



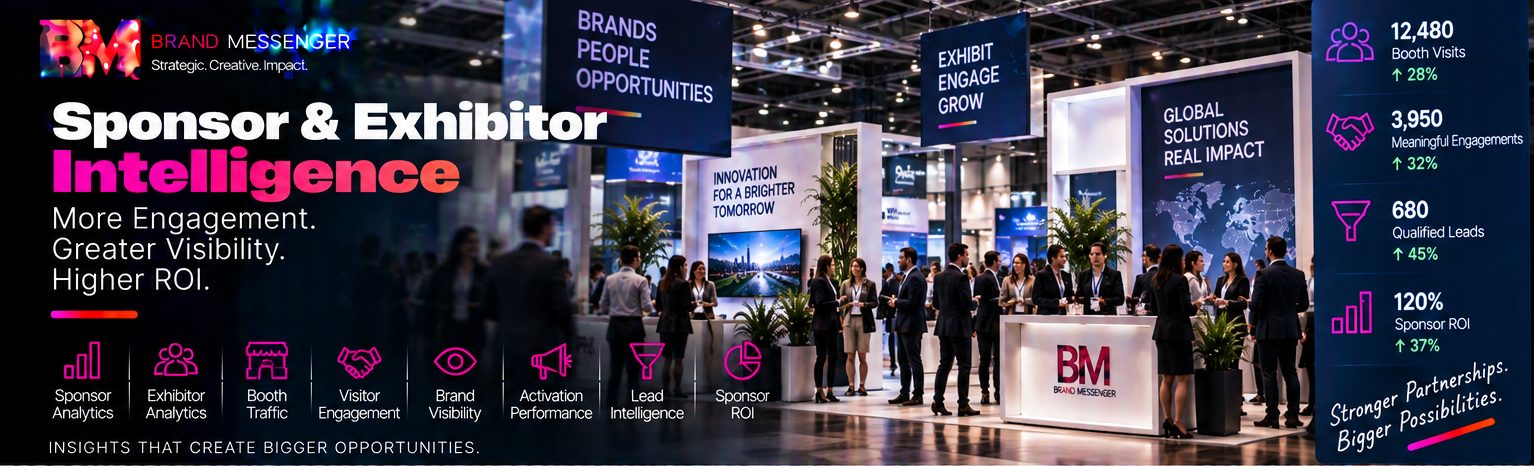
Sponsor & Exhibitor Intelligence
Measure Sponsor Value. Understand Exhibitor Performance. Analyze Booth Engagement. Turn Event Participation into Actionable Business Intelligence.
Sponsors and exhibitors are often among the most important commercial stakeholders in an event.
They invest in sponsorship packages, exhibition space, booths, activations, branded experiences, content, hospitality, networking and lead generation with an expectation that the event will create meaningful visibility, engagement, relationships or business opportunities.
Yet traditional event reporting often stops at:
Logo Placement
Booth Size
Estimated Attendance
Number of Leads
That provides only part of the picture.
At Brand Messenger, our Sponsor & Exhibitor Intelligence service connects sponsor analytics, exhibitor analytics, booth traffic, visitor engagement, sponsor visibility, activation performance, lead intelligence and sponsor/exhibitor ROI into a more complete event-performance intelligence environment.
Our core capabilities include:
Sponsor Analytics
Exhibitor Analytics
Booth Traffic Intelligence
Visitor Engagement Analytics
Sponsor Visibility Intelligence
Activation Performance
Lead Intelligence
Sponsor & Exhibitor ROI Analysis
Our wider capabilities can extend across sponsor package measurement, booth-performance dashboards, visitor-flow analytics, dwell analysis, activation engagement, sponsored-session analytics, digital sponsor engagement, event-app activity, lead capture, lead qualification, business matchmaking, meeting intelligence, product-interest analytics, content engagement, hybrid-event analytics, CRM integration, marketing automation, revenue attribution, post-event reporting, executive dashboards, benchmarking and AI-assisted event intelligence.
Our intelligence architecture connects:
Sponsor / Exhibitor Investment → Visibility → Visitor Traffic → Engagement → Interaction → Lead → Meeting → Opportunity → Business Outcome → Performance Intelligence
The objective is not simply to tell sponsors and exhibitors:
“Your Brand Was Seen.”
It is to help answer:
Who Engaged? Where Did Engagement Happen? What Activities Generated Interest? What Business Opportunities Emerged? And What Can Be Improved at the Next Event?
From Sponsorship Exposure to Sponsorship Intelligence
Traditional sponsorship measurement may focus heavily on exposure.
Brand Messenger expands the measurement framework:
Exposure
↓
Attention
↓
Engagement
↓
Interaction
↓
Lead / Connection
↓
Opportunity
↓
Business Outcome
This creates a more meaningful view of sponsorship performance.
Not every sponsor needs every stage.
A brand-awareness sponsor may primarily value:
Visibility + Engagement
while a B2B sponsor may prioritize:
Meetings + Leads + Opportunities
and an exhibitor may focus on:
Booth Traffic + Product Interest + Qualified Leads.
The measurement model should reflect the actual objective.
Sponsor & Exhibitor Intelligence Starts with Objectives
Before measuring performance, Brand Messenger can define what the sponsor or exhibitor is trying to achieve.
Potential objectives can include:
Brand Awareness
Market Visibility
Thought Leadership
Product Awareness
Product Demonstration
Audience Engagement
Lead Generation
Business Development
Networking
Partner Development
Customer Engagement
Recruitment
Investor Engagement
Sales Opportunities
This creates the foundation for meaningful measurement.
Objective → KPI → Data → Intelligence → Decision
Brand Messenger Sponsor & Exhibitor Intelligence Services
Our capabilities can include:
Sponsor Intelligence Strategy
Exhibitor Intelligence Strategy
Sponsor KPI Framework
Exhibitor KPI Framework
Sponsor Analytics
Exhibitor Analytics
Sponsorship Performance Dashboards
Exhibitor Performance Dashboards
Live Sponsor Dashboards
Live Exhibition Dashboards
Booth Traffic Analytics
Booth Visitor Analytics
Booth Dwell Analysis
Visitor Flow Analytics
Exhibition Zone Analytics
Sponsor Visibility Measurement
Digital Sponsor Visibility
Sponsored Content Analytics
Sponsored Session Analytics
Sponsor Activation Analytics
Experiential Activation Measurement
Interactive Activation Analytics
Product Interest Analytics
Product Demonstration Analytics
Visitor Engagement Analytics
Lead Capture Analytics
Lead Intelligence
Lead Qualification Intelligence
Lead Source Analysis
Meeting Intelligence
Networking Analytics
Business Matchmaking Analytics
Event App Sponsor Analytics
QR Interaction Analytics
Interactive Kiosk Analytics
Touch Display Analytics
AR/VR Activation Analytics
Gamification Analytics
Livestream Sponsor Analytics
Hybrid Sponsor Analytics
Virtual Exhibitor Analytics
CRM Integration
Marketing Automation Integration
Sales Pipeline Integration
Revenue Attribution where measurable
Sponsor ROI Analysis
Exhibitor ROI Analysis
Sponsor ROO / Objective-Based Reporting
Post-Event Sponsor Reports
Post-Event Exhibitor Reports
Multi-Event Benchmarking
AI-Assisted Sponsor Intelligence
Executive Sponsorship Reporting
Sponsor Analytics
Understand Sponsorship Beyond Placement
A sponsorship package can include:
Event Naming
Stage Branding
Venue Branding
Digital Branding
Sponsored Sessions
Exhibition Space
Hospitality
Networking
Content
Event App Placement
Interactive Activations
Livestream Integration
Social Media
Lead Generation
Each element creates different types of value.
Brand Messenger can structure sponsor analytics around those differences rather than combining every activity into one generic metric.
Sponsor Performance Architecture
A sponsor-performance model can become:
Sponsorship Objective
↓
Sponsorship Assets
↓
Audience Exposure
↓
Audience Engagement
↓
Activation Interaction
↓
Lead / Relationship
↓
Business Opportunity
↓
Defined Outcome
This provides a clearer framework for understanding sponsorship contribution.
Sponsor KPI Framework
Potential sponsor KPIs can be organized across:
Visibility
Brand Exposure Digital Visibility Content Exposure
Engagement
Activation Interaction Content Engagement Session Participation
Audience
Relevant Visitor Activity Audience Segments where appropriate
Relationships
Leads Meetings Networking
Business
Opportunities Revenue where reliably connected ROI where measurable
This allows sponsor reporting to reflect multiple dimensions of value.
Sponsor Visibility Intelligence
Understand Where the Sponsor Appears Across the Event Journey
Sponsor visibility can extend across:
Pre-Event Marketing
↓
Registration
↓
Venue
↓
Stage
↓
Sessions
↓
Exhibition
↓
Event App
↓
Livestream
↓
Social Content
↓
Post-Event Content
Brand Messenger can map sponsor visibility across the entire event ecosystem.
Physical Sponsor Visibility
Physical sponsor presence may include:
Stage Screens
Venue Screens
Signage
Exhibition Areas
Networking Lounges
Registration Areas
Sponsor Activations
Branded Environments
Measurement possibilities depend on the technologies and event configuration available.
Digital Sponsor Visibility
Digital sponsor presence can include:
Event Website
Registration Journey
Event App
Virtual Event Portal
Livestream
Digital Content
Email Campaigns
Social Media
On-Demand Content
Digital environments can often provide additional interaction data around appropriate sponsor assets.
Visibility Is Not the Same as Engagement
A logo displayed on a screen creates potential exposure.
A visitor actively interacting with a sponsor experience represents a different type of signal.
Therefore:
Visibility → Engagement → Interaction
should not be treated as interchangeable metrics.
Where useful and measurable, Brand Messenger can map how sponsor assets are distributed across:
Venue
Program
Content
Digital Platforms
Networking
Activations
This can help organizers understand whether sponsorship delivery aligns with the agreed package.
It should not be presented as proof that every attendee noticed or remembered each placement.
Sponsored Session Intelligence
Sponsors may support:
Keynotes
Panels
Workshops
Roundtables
Product Sessions
Thought Leadership Sessions
Brand Messenger can analyze appropriate signals such as:
Session Attendance
Capacity
Poll Participation
Q&A Activity
Feedback
Digital Viewing
On-Demand Viewing
This helps move sponsored-session reporting beyond:
“The Session Happened.”
toward:
“How Did the Audience Participate?”
Thought Leadership Performance
For sponsors using events to build authority, relevant indicators may include:
Session Attendance
Audience Questions
Content Engagement
Post-Session Interest
Follow-Up Activity
These signals can provide evidence of audience interest without claiming that exposure automatically changed audience perception.
Sponsor Activation Performance
Measure What Happens Inside the Activation
A sponsor activation may include:
Interactive Booth
Product Experience
Competition
Game
AR / VR Experience
Photo Experience
Touch Display
Kiosk
Product Demonstration
Sampling
Digital Experience
Brand Messenger can measure appropriate activity around these experiences.
The architecture becomes:
Visitor → Discover → Enter → Interact → Engage → Respond → Continue
Activation Engagement
Potential signals can include:
Activation Visits
Interactions
Participation
Completion
Content Engagement
QR Actions
Lead Capture
Follow-Up Requests
depending on the activation design.
Activation Performance Is More Than Footfall
High traffic around an activation does not automatically mean high engagement.
A better framework can consider:
Traffic
↓
Interaction
↓
Engagement
↓
Action
For example:
1,000 People Passed the Activation
is different from:
300 Entered
which is different from:
150 Participated
which is different from:
40 Requested Follow-Up.
Each stage describes a different behavior.
Exhibitor Analytics
Understand How the Exhibition Floor Performs
Exhibitors need more than an estimate of total event attendance.
They need intelligence around their own participation.
Brand Messenger can connect:
Exhibition Traffic → Booth Traffic → Booth Engagement → Product Interest → Lead → Meeting → Opportunity
to provide a more useful exhibitor-performance view.
Exhibitor Performance Dashboard
Potential areas can include:
Traffic
Booth Visits Traffic Patterns Peak Periods
Engagement
Interactions Dwell Product Experiences
Leads
Captured Leads Qualified Leads where defined
Networking
Meetings Business Matchmaking
Content
Downloads QR Engagement Digital Interaction
Business
Opportunities Revenue where reliably connected
This creates a more complete exhibitor-performance environment.
Booth Traffic Intelligence
Understand Visitor Activity Around the Booth
Where appropriate analytics are available, Brand Messenger can help analyze:
Visitor Traffic
Entry Activity
Peak Periods
Traffic by Time
Repeat-Visit Trends
Surrounding Zone Activity
This can help exhibitors understand when and how their booth attracted visitor activity.
Booth Traffic vs. Exhibition Traffic
An exhibition may have high overall attendance while an individual booth receives relatively limited traffic.
Therefore:
Event Attendance
≠
Exhibition Traffic
≠
Booth Traffic
These should be measured separately where possible.
Booth Traffic Funnel
A useful booth-performance architecture can become:
Event Visitor
↓
Exhibition Visitor
↓
Booth Visitor
↓
Engaged Visitor
↓
Lead
↓
Qualified Lead
↓
Opportunity
↓
Customer
This provides a clearer view of the exhibitor journey.
Booth Dwell Intelligence
Where appropriate technology supports it, aggregated dwell patterns can help indicate how long visitors spend within selected exhibition areas.
Potential applications include:
Booth Design Evaluation
Product Display Evaluation
Demonstration Performance
Activation Analysis
But dwell requires context.
Longer Dwell Can Indicate Engagement or Friction. Context Determines the Interpretation.
Booth Traffic by Time
Exhibitors can analyze:
Morning
Midday
Afternoon
or session/break periods to identify when booth activity is strongest.
This can support future decisions around:
Staff Scheduling
Demonstrations
Product Presentations
Promotions
Meeting Availability
Exhibition Zone Intelligence
Brand Messenger can evaluate exhibition performance by:
Hall
Zone
Category
Pavilion
Sponsor Area
where appropriate data is available.
The architecture becomes:
Event → Exhibition → Zone → Booth → Engagement
Visitor Flow + Exhibition Intelligence
Booth performance can be influenced by:
Location
Entrances
Main Traffic Routes
Session Timings
Food & Hospitality Areas
Networking Areas
Nearby Activations
Connecting visitor-flow intelligence with booth analytics can help explain the wider physical context around exhibitor performance.
Visitor Engagement Analytics
Understand What Visitors Actually Do
Visitor engagement can include:
Product Demonstrations
Touchscreen Interactions
Kiosk Use
QR Scans
AR / VR Experiences
Competitions
Games
Content Downloads
Meeting Requests
Lead Forms
The architecture becomes:
Visit → Interaction → Engagement → Action
Engagement Depth
Not all engagement is equal.
Brand Messenger can structure interactions by depth where useful.
For example:
Exposure
Passed / Saw Relevant Placement
Interaction
Touched / Scanned / Opened
Engagement
Explored / Participated / Watched
Intent Signal
Requested Information / Meeting
Business Signal
Qualified Lead / Opportunity
This helps prevent superficial interactions from being presented as business outcomes.
Product Interest Intelligence
For product-focused exhibitions, Brand Messenger can analyze appropriate signals around:
Product Pages
QR Codes
Interactive Displays
Demonstrations
Product Downloads
Information Requests
This can help exhibitors understand which products generated stronger observable interest.
Product Demonstration Analytics
A product demonstration can be evaluated through:
Demonstration Attendance
Audience Interaction
Questions
Information Requests
Follow-Up Actions
where those signals are available.
Interactive Kiosk Analytics
Brand Messenger's Interactive Kiosk capabilities can provide appropriate interaction data such as:
Sessions
Content Viewed
Product Categories Explored
Form Completions
QR Actions
depending on kiosk design and privacy requirements.
Touch Display Analytics
Interactive displays can provide information around:
Content Selected → Product Explored → Interaction Path → Action
This can help improve future booth content and experience design.
AR / VR Activation Analytics
For immersive experiences, appropriate indicators can include:
Participation
Experience Starts
Experience Completion
Content Interaction
Follow-Up Actions
depending on the system deployed.
The goal is not simply:
How Many People Used the Headset?
but:
What Role Did the Experience Play in the wider visitor journey?
QR Engagement Intelligence
QR experiences can connect physical event environments with digital measurement.
The journey becomes:
Physical Booth → QR → Product / Content Experience → Action
Potential actions can include:
View Product
Download Content
Request Information
Book Meeting
Visit Website
Lead Intelligence
Move Beyond Counting Business Cards
A lead is more useful when the organization understands the context around it.
Brand Messenger can connect lead capture with appropriate information such as:
Source
Booth
Activation
Product Interest
Session
Meeting
Requested Information
The architecture becomes:
Interaction → Lead → Context → Qualification → Follow-Up
Lead Capture
Lead capture can occur through:
QR Codes
Smart Badges
Event Apps
Forms
Kiosks
Business Matchmaking
Meeting Systems
Exhibitor Lead Applications
where attendees voluntarily provide or exchange appropriate information.
Lead Quantity vs. Lead Quality
More leads do not automatically mean better event performance.
A sponsor might generate:
500 Contacts
while another generates:
100 More Relevant Business Conversations.
The appropriate evaluation depends on the sponsor's objectives and agreed lead definition.
Lead Qualification Intelligence
Where relevant information and agreed criteria exist, leads can be categorized according to factors such as:
Business Need
Product Interest
Organization Type
Market
Follow-Up Requirement
AI-assisted scoring may support prioritization where appropriate, but should not replace human review for consequential business decisions.
Lead Source Intelligence
A lead may originate from:
Booth
Sponsored Session
Networking
Product Demonstration
Event App
QR Experience
Virtual Booth
Sponsor Activation
Understanding the source helps identify which experiences are contributing to lead generation.
Lead Journey Intelligence
The journey can continue:
Event Interaction → Lead → CRM → Follow-Up → Qualification → Opportunity
This connects event intelligence with sales activity.
CRM Integration
Connect Event Leads with the Business Relationship
Brand Messenger can connect appropriate sponsor/exhibitor lead information with CRM systems where supported.
The architecture becomes:
Event Lead
↓
CRM
↓
Sales Follow-Up
↓
Qualification
↓
Opportunity
↓
Customer
This allows reporting to continue beyond the event.
Marketing Automation
Appropriate lead signals can support workflows such as:
Product Interest → Product Information
Meeting Request → Sales Follow-Up
Event Lead → Relevant Nurture Journey
This connects Sponsor & Exhibitor Intelligence with Brand Messenger's wider MarTech ecosystem.
Meeting Intelligence
Measure Business Conversations Created by the Event
For B2B events, meetings can be a major performance indicator.
Potential measures can include:
Meeting Requests
Accepted Meetings
Scheduled Meetings
Completed Meetings where captured
Follow-Up Activity
The architecture becomes:
Networking → Meeting → Relationship → Opportunity
Business Matchmaking Intelligence
Brand Messenger can connect its networking and matchmaking technology with sponsor/exhibitor reporting.
For example:
Sponsor / Exhibitor Profile
↓
Relevant Attendee
↓
Match Recommendation
↓
Meeting Request
↓
Meeting
↓
Follow-Up
This can be particularly valuable for:
B2B Conferences
Trade Shows
Investor Forums
Industry Summits
Buyer-Seller Meetings
Networking Is a Business Signal not Automatically Revenue
A meeting can indicate meaningful business activity.
But:
Meeting / Opportunity
and:
Opportunity / Revenue.
Brand Messenger maintains these distinctions throughout reporting.
Sponsor & Exhibitor Event App Intelligence
The event app can provide a digital engagement layer.
Potential sponsor/exhibitor signals can include:
Profile Views
Product Content
Session Discovery
Meeting Requests
Relevant Content Interaction
depending on platform capabilities.
Hybrid Sponsor Intelligence
For Hybrid Events, sponsor participation can extend across both environments.
Physical
Venue Branding Booth Sessions Activation Networking
Virtual
Digital Sponsor Placement Virtual Booth Livestream Content Virtual Networking
Brand Messenger can create:
Physical Sponsor Intelligence + Digital Sponsor Intelligence → Hybrid Sponsorship Intelligence
Virtual Exhibitor Intelligence
Virtual exhibition environments can provide appropriate data around:
Exhibitor Profile Activity
Product Content
Video
Downloads
Meetings
Lead Requests
depending on platform capabilities.
Physical and virtual engagement should be reported using metrics appropriate to each environment.
Sponsor Content Intelligence
Sponsors may produce:
Articles
Videos
Interviews
Presentations
Product Content
Thought Leadership
Brand Messenger can connect appropriate content engagement with wider sponsor reporting.
Livestream Sponsor Intelligence
For livestreamed or hybrid events, sponsor reporting can include appropriate digital indicators around:
Sponsored Session Viewing
Sponsor Content Interaction
Digital Activation
where measurable.
A stream view should not automatically be counted as confirmed sponsor attention unless the measurement supports that conclusion.
Social Sponsor Intelligence
Where social campaigns form part of the sponsorship package, reporting can connect appropriate:
Content Reach
Engagement
Clicks
Video Activity
Campaign Actions
with the broader sponsor-performance report.
Sponsor Activation + Audience Segmentation
Where appropriate, privacy-aware audience segments can help sponsors understand which broad audience groups interacted with selected activations.
This may include:
Attendee Category
Industry
Professional Role
Market
where that information has been appropriately collected and can be used for the stated purpose.
Sensitive or unnecessary profiling should be avoided.
Sponsor & Exhibitor Audience Intelligence
The broader question becomes:
Which Audiences Engaged with Which Experiences?
The architecture can become:
Audience Segment → Sponsor / Exhibitor → Experience → Engagement → Action
This can support better future activation design.
Physical-Space Intelligence
Where appropriate sensing or analytics technologies are available, Brand Messenger can incorporate aggregated signals around:
Visitor Traffic
Movement
Zone Activity
Dwell
Crowd Patterns
into sponsor and exhibitor intelligence.
This can help explain how physical event environments are being used.
Face Signatures Integration
Where appropriate, Face Signatures by Messenger2050 Technologies may provide a supporting physical-space analytics layer for selected sponsor and exhibition environments.
Depending on deployment requirements and configuration, appropriate capabilities may contribute signals around:
Visitor Traffic
Movement Patterns
Zone Activity
Repeat-Visit Trends
Crowd Patterns
Physical-Space Engagement
These signals can complement:
Booth Data + Event App + Lead Capture + Networking + CRM
to provide broader event intelligence.
Sponsor Intelligence Does Not Require Identifying Every Visitor
Many useful questions can be answered using aggregated analytics.
For example:
How Much Traffic Reached the Booth?
When Was Activity Highest?
Which Activation Attracted More Participation?
Which Zone Received Greater Traffic?
may not require knowing individual identities.
Our principle is:
Use Identity When Identity Is Necessary. Use Aggregated Intelligence When It Is Enough.
Where biometric or identity-linked processing is proposed, appropriate privacy, security, transparency, permissions or other lawful basis, retention and governance requirements should be addressed.
Behavioral Signals Require Context
A visitor:
Entering a Booth
Spending Time at a Display
Returning to an Area
Interacting with Content
creates an observable signal.
It does not automatically reveal:
Purchase Intent
Satisfaction
Personal Preference
Motivation
The analytical model should remain:
Observed Behavior → Signal → Analysis → Hypothesis → Validation
not:
Observed Behavior → Assumed Intent.
AI-Powered Sponsor & Exhibitor Intelligence
Find Patterns Across Complex Event Data
AI-assisted analytics can help analyze appropriate combinations of:
Traffic
Engagement
Sessions
Leads
Meetings
Content
CRM Outcomes
to identify patterns that may deserve attention.
The architecture becomes:
Event Signals → AI Analysis → Patterns → Insights → Human Interpretation → Decision
AI-Assisted Performance Insights
Potential applications can include identifying:
Unusual Booth Traffic Patterns
High-Activity Periods
Stronger Engagement Areas
Changes in Activation Participation
Lead Patterns
Meeting Patterns
where sufficient reliable data exists.
AI provides decision support.
It does not eliminate the need for commercial and event expertise.
Predictive Sponsor Intelligence
Where sufficient historical data exists, predictive analytics can support estimates around:
Expected Booth Traffic
Activation Demand
Lead Volume
Meeting Demand
Sponsor Content Engagement
These remain forecasts rather than guarantees.
Live Sponsor Dashboards
Give Sponsors Relevant Visibility During the Event
Where systems support timely data, a sponsor dashboard can provide selected indicators during the event.
Potential sections can include:
Visibility
Activation
Traffic
Engagement
Leads
Meetings
This can help sponsor teams understand event activity while the event is still running.
Live Exhibitor Dashboards
An exhibitor dashboard can potentially provide:
Booth Activity
Peak Times
Lead Capture
Meeting Activity
Digital Engagement
depending on available technology.
This can support operational decisions during multi-day exhibitions.
Sponsor & Exhibitor Dashboard Design
Not every stakeholder needs the same dashboard.
Sponsor
Visibility + Activation + Engagement + Leads
Exhibitor
Traffic + Product Interest + Leads + Meetings
Event Organizer
All Sponsors + All Exhibitors + Exhibition Performance
Commercial Director
Sponsorship Delivery + Partner Performance + Renewal Intelligence
Executive Management
Commercial Outcomes + Strategic Performance
This creates role-based intelligence.
Live Event Dashboards Integration
Sponsor & Exhibitor Intelligence can connect directly with Brand Messenger's Live Event Dashboards & Performance Intelligence service.
The architecture becomes:
Live Event Dashboard
↓
Venue
Audience
Sessions
Engagement
Sponsors
Exhibitors
Commercial Performance
This allows sponsor and exhibition intelligence to become part of the wider event command environment.
Sponsor & Exhibitor ROI
Connect Investment with Measurable Outcomes
ROI analysis requires reliable cost and outcome information.
A simplified financial ROI framework can consider:
Measured Financial Return − Sponsorship / Exhibition Investment
relative to:
Sponsorship / Exhibition Investment
But not every sponsorship objective is immediately financial.
Sponsors may invest for:
Awareness
Thought Leadership
Relationships
Market Entry
Product Education
Community Engagement
These should not be converted into invented financial values merely to produce an attractive ROI percentage.
ROI vs. ROO
For some sponsorships, Return on Objectives (ROO) may be more appropriate than purely financial ROI.
For example:
Objective
Build Thought Leadership
Relevant Indicators
Sponsored Session Attendance Content Engagement Audience Questions
Or:
Objective
Generate B2B Opportunities
Relevant Indicators
Qualified Leads Meetings Opportunities
The principle is:
Measure Performance Against the Objective the Sponsor Actually Bought the Sponsorship to Achieve.
Exhibitor ROI
Exhibitor investment may include:
Booth Cost
Design
Production
Staff
Travel
Technology
Marketing
Where reliable revenue or opportunity information is available, this can be compared with appropriate business outcomes.
But early-stage leads should not automatically be counted as revenue.
Cost per Lead
Where costs and lead definitions are clear:
Exhibition Investment ÷ Defined Leads
can provide a cost-per-lead indicator.
However, lead quality remains important.
A lower cost per lead is not necessarily more valuable if those leads are poorly aligned with the exhibitor's objectives.
Cost per Qualified Lead
Where qualification criteria are established, organizations can also evaluate:
Event Investment ÷ Qualified Leads
This may provide a more meaningful commercial measure for some B2B exhibitors.
Event-Sourced Opportunities
CRM integration can help distinguish:
Lead
from:
Opportunity
and potentially identify opportunities associated with event activity.
This provides stronger business intelligence than counting captured contacts alone.
Revenue Attribution
Where a CRM contains reliable opportunity and revenue information, Brand Messenger can connect event interactions with later business outcomes.
However:
Event Interaction Before a Sale Does Not Automatically Prove the Event Caused the Sale.
Attribution assigns contribution according to a chosen methodology.
Causal impact requires stronger evidence.
Sponsor Attribution vs. Incrementality
A sponsor activation may appear somewhere in the customer journey before an outcome.
That does not necessarily mean the outcome would not have occurred without the activation.
Therefore:
Attribution Assigns Contribution. Incrementality Investigates Additional Effect.
This distinction becomes important when evaluating higher-value sponsorship investments.
Sponsor Renewal Intelligence
Use Performance Data to Improve Future Partnerships
Sponsor intelligence can support future conversations around:
Renewal
Package Design
Activation Strategy
Content
Networking
Audience Alignment
Sponsorship Level
The purpose should not be to pressure sponsors into renewal.
It is to provide evidence that helps both organizer and sponsor make a better-informed decision.
Sponsor Package Optimization
Historical performance can help organizers understand which package components appear to generate stronger engagement for particular objectives.
This can support future sponsorship design.
For example:
Brand Visibility Package
Thought Leadership Package
Lead Generation Package
Networking Package
Experiential Activation Package
rather than relying only on traditional tier labels.
Exhibitor Placement Intelligence
Historical visitor-flow and booth-performance data can support future exhibition planning.
Potential questions include:
Which areas received higher traffic?
Which zones experienced congestion?
Which areas were underused?
How did nearby attractions affect movement?
Placement should still consider operational, commercial and contractual requirements.
Multi-Day Exhibitor Intelligence
For multi-day events, exhibitors can compare:
Day 01 → Day 02 → Day 03
across:
Traffic
Engagement
Leads
Meetings
This can help teams adapt demonstrations, staffing and follow-up during the event.
Multi-Event Sponsor Intelligence
For recurring event portfolios, Brand Messenger can connect performance across:
Event A
↓
Event B
↓
Event C
to help sponsors understand participation over time.
Comparable KPI definitions are important when benchmarking across events.
Multi-City Sponsor Intelligence
For roadshows or event series:
London → Dubai → Singapore → New York
or other market combinations can be analyzed by location where appropriate.
This can help organizations understand differences in:
Audience
Engagement
Leads
Meetings
Activation Performance
without assuming that every market should behave identically.
Sponsor & Exhibitor Benchmarking
Performance can potentially be compared across:
Event Editions
Booth Types
Activation Types
Sessions
Markets
Event Formats
where comparable data exists.
Benchmarking should compare like with like.
A small specialist B2B booth should not automatically be judged against a large consumer activation using the same volume metrics.
Post-Event Sponsor Reporting
Give Sponsors More Than a Thank-You Email
Brand Messenger can create structured sponsor performance reports containing appropriate:
Sponsorship Delivery
Agreed Assets Delivered Assets
Audience
Relevant Event Audience Information
Visibility
Physical + Digital Presence
Engagement
Activations Sessions Content
Relationships
Leads Meetings
Business Outcomes
Opportunities / Revenue where reliably available
Insights
Observed Patterns
Recommendations
Future Activation Opportunities
This creates a professional sponsorship reporting environment.
Post-Event Exhibitor Reporting
Exhibitor reports can include:
Booth Traffic
Peak Periods
Engagement
Product Interest
Leads
Meetings
Digital Activity
Relevant Follow-Up Outcomes
This helps exhibitors evaluate both event participation and future improvements.
Sponsor Performance Story
A useful sponsor report should not simply present a wall of metrics.
It should explain the performance journey:
Investment → Presence → Audience → Engagement → Relationship → Outcome
This gives the sponsor context around the numbers.
Data Quality & Measurement Limitations
Sponsor intelligence depends on:
Technology Coverage
Data Completeness
Tracking Configuration
Lead Definitions
CRM Quality
Participation
Integration Availability
Brand Messenger should distinguish:
Measured
from:
Estimated
and:
Inferred
information.
This is especially important when reporting ROI.
Privacy-Aware Sponsor & Exhibitor Intelligence
Sponsor analytics can involve:
Registration Data
Lead Data
Networking Data
App Activity
Physical-Space Signals
CRM Data
Brand Messenger's approach can incorporate:
Defined Purpose
Data Minimization
Transparency
Appropriate Permissions
Role-Based Access
Security
Retention
Aggregation where sufficient
The principle is:
Measure Commercial Performance Without Turning Event Intelligence into Unnecessary Visitor Surveillance.
Sponsor Data Access
Sponsors should receive information appropriate to:
Their Sponsorship Package
Their Interactions
Their Leads
Their Legitimate Reporting Requirements
rather than unrestricted access to the event's wider attendee dataset.
This helps protect both attendee privacy and organizer data governance.
Sponsor & Exhibitor Intelligence Maturity Model
Level 01 — Basic Reporting
Event Attendance + Lead Count + Sponsorship Delivery
Level 02 — Traffic & Engagement Intelligence
Booth Traffic + Activation Participation + Digital Engagement
Level 03 — Connected Sponsor Intelligence
Visibility + Traffic + Engagement + Leads + Meetings
Level 04 — CRM-Connected Commercial Intelligence
Event Activity → Lead → Qualification → Opportunity
Level 05 — Business Performance Intelligence
Sponsor / Exhibitor Investment → Engagement → Opportunities → Revenue / Defined Objectives
Level 06 — AI-Powered Sponsor & Exhibitor Intelligence
Physical + Digital Event Data + AI Analysis + Predictive Intelligence + Live Dashboards + Executive BI
The goal is not simply more measurement.
It is:
Better Evidence for Better Sponsorship, Exhibition and Business Decisions.
Complete Brand Messenger Sponsor & Exhibitor Intelligence Process
A comprehensive engagement can follow:
Sponsor / Exhibitor Objective
↓
Sponsorship / Exhibition Package
↓
Measurement Framework
↓
KPI Definition
↓
Technology & Tracking Architecture
↓
Event Audience
↓
Visibility
↓
Exhibition / Booth Traffic
↓
Visitor Engagement
↓
Activation Performance
↓
Product Interest
↓
Lead Capture
↓
Networking & Meetings
↓
CRM
↓
Lead Qualification
↓
Opportunities
↓
Revenue / Defined Business Outcomes
↓
ROI / ROO Analysis
↓
Live Dashboard
↓
Post-Event Reporting
↓
Sponsor / Exhibitor Insights
↓
Renewal & Future Event Strategy
The lifecycle becomes:
Expose → Attract → Engage → Connect → Qualify → Measure → Understand → Improve
Across the Brand Messenger Sponsor & Exhibitor Intelligence Ecosystem
Event Marketing & Audience Acquisition
Bring Relevant Audiences to the Event
↓
Event Registration, Ticketing & Smart Check-In
Create Registration and Attendance Intelligence
↓
Event Technology & Smart Event Experiences
Create Digital and Interactive Touchpoints
↓
Event Audience Engagement & Interactive Experiences
Create Participation Signals
↓
Conferences, Summits & Business Forums
Create the Business Event Environment
↓
Hybrid Events
Connect Physical + Virtual Sponsor Experiences
↓
Event Content, Media & Live Production
Deliver Sponsor Content Across Stage, Screen and Stream
↓
AI Event Intelligence & Audience Analytics
Analyze Audience, Movement and Engagement
↓
Live Event Dashboards & Performance Intelligence
Connect Live Event KPIs and Operational Intelligence
↓
Sponsor & Exhibitor Intelligence
Sponsor Analytics • Exhibitor Analytics • Booth Traffic • Visitor Engagement • Sponsor Visibility • Activation Performance • Lead Intelligence • ROI / ROO
↓
CRM + CDP
Connect Leads with Customer and Business Relationships
↓
Marketing Automation
Continue Relevant Follow-Up
↓
Customer Journey Analytics
Understand Sponsor / Exhibitor Touchpoints Within the Wider Journey
↓
Predictive Analytics
Add Forward-Looking Intelligence Where Reliable Data Supports It
↓
Revenue Performance Marketing
Connect Marketing and Event Investment with Business Performance
↓
Marketing Dashboard & KPI Reporting
Bring Event Commercial Intelligence into Wider Executive Reporting
The complete architecture becomes:
Audience → Sponsor / Exhibitor → Visibility → Traffic → Engagement → Interaction → Lead → Meeting → Opportunity → Revenue / Objective → Intelligence
Events We Can Support
Brand Messenger Sponsor & Exhibitor Intelligence can support appropriate applications across:
Trade Shows
Exhibitions
Conferences
Business Summits
Executive Forums
Conventions
Industry Events
B2B Events
Investor Forums
Buyer-Seller Meetings
Product Launches
Corporate Events
Brand Activations
Technology Events
Automotive Events
Real Estate Exhibitions
Healthcare Events
Tourism Events
Education Events
Government Events
Sports Events
Entertainment Events
Film Festivals
Award Shows
Hybrid Events
Virtual Exhibitions
Multi-Day Events
Multi-City Roadshows
International Events
Benefits of Sponsor & Exhibitor Intelligence
Brand Messenger can help organizations:
Establish sponsor and exhibitor KPI frameworks
Measure sponsorship beyond logo placement
Understand physical and digital sponsor visibility
Analyze booth traffic
Understand exhibition traffic patterns
Analyze visitor engagement
Evaluate dwell patterns where appropriate
Measure activation performance
Understand product interest
Analyze interactive experiences
Connect QR and digital engagement
Improve lead capture intelligence
Distinguish lead quantity from lead quality
Connect event leads with CRM
Analyze business matchmaking
Measure meeting activity
Connect physical and virtual sponsorship
Develop live sponsor dashboards
Develop exhibitor dashboards
Create sponsor post-event reports
Create exhibitor performance reports
Evaluate ROI where financial data supports it
Evaluate ROO for objective-led sponsorships
Connect opportunities and revenue where reliably measurable
Benchmark recurring events
Improve future sponsorship packages
Support sponsor renewal discussions with evidence
Improve exhibition planning
Apply AI-assisted analysis where appropriate
Build privacy-aware sponsor intelligence
Why Choose Brand Messenger?
Brand Messenger combines event strategy, sponsorship, exhibitions, event technology, physical-space intelligence, visitor analytics, lead capture, networking technology, CRM, marketing automation, AI Event Intelligence, live dashboards and business-performance reporting within one connected sponsor and exhibitor intelligence ecosystem.
We do not approach sponsor reporting as:
Event Attendance + Logo Placement + Lead Count = Sponsor Success.
We approach it as:
Define the Objective → Understand the Investment → Measure the Presence → Analyze the Traffic → Understand Engagement → Capture Relevant Leads → Measure Meetings → Connect CRM Outcomes → Evaluate Performance → Build Better Future Activations.
The distinction matters.
Sponsor Analytics shows how sponsorship assets perform.
Exhibitor Analytics helps businesses understand their exhibition participation.
Booth Traffic Intelligence measures physical visitor activity where appropriate.
Visitor Engagement Analytics moves beyond presence into observable interaction.
Sponsor Visibility Intelligence maps presence across physical and digital event environments.
Activation Performance helps evaluate experiential investment.
Lead Intelligence connects interactions with relevant business follow-up.
CRM Integration helps continue the measurement from lead to opportunity.
Live Dashboards provide timely visibility during the event.
Post-Event Intelligence turns event activity into a structured performance story.
And ROI / ROO Analysis connects performance with the sponsor's actual commercial or strategic objectives.
The result is not simply a sponsor report.
It is a connected commercial event intelligence environment designed to help organizers, sponsors and exhibitors understand what happened, what generated engagement, where business opportunities emerged and how the next event can perform more effectively.
Measure the Visibility. Understand the Traffic. Analyze the Engagement. Connect the Leads. Prove What Can Be Measured. Improve What Comes Next.
Sponsor Analytics. Exhibitor Analytics. Booth Traffic. Visitor Engagement. Sponsor Visibility. Activation Performance. Lead Intelligence. ROI & ROO. One Connected Sponsor & Exhibitor Intelligence Ecosystem.