






Marketing Dashboard & KPI Reporting
Turn Marketing Data into Executive Intelligence. Monitor What Matters. Visualize Performance. Make Faster, Better-Informed Decisions.
Modern organizations generate marketing data across dozens of channels, campaigns, customer systems and technology platforms.
Advertising platforms report media performance. CRM systems contain leads and customer outcomes. Marketing automation tracks engagement. Websites and apps generate behavioral data. E-commerce systems record transactions. Customer Journey Analytics reveals paths. Attribution analyzes contribution. Finance measures revenue and return.
The challenge is no longer simply having data.
The challenge is turning that data into clear, consistent and decision-ready information for marketing teams, management and executive leadership.
At Brand Messenger, our Marketing Dashboard & KPI Reporting service brings marketing, advertising, customer, campaign and business performance information into structured dashboards, executive reports and visual performance environments.
Our five core capabilities are:
Live Dashboards
Executive Reports
KPI Monitoring
ROI Reporting
Performance Visualization
Our wider capabilities can extend across CMO dashboards, campaign dashboards, channel dashboards, paid-media dashboards, customer dashboards, revenue marketing reports, funnel reporting, CLV reporting, journey reporting, budget monitoring, performance alerts, target tracking, trend analysis, AI-assisted reporting, automated reporting, multi-brand reporting, multi-market dashboards and enterprise marketing intelligence.
The objective is not to put every available number on one screen.
It is:
Connect the Data. Define the KPIs. Visualize the Performance. Give Decision-Makers the Information They Actually Need.
What Is Marketing Dashboard & KPI Reporting?
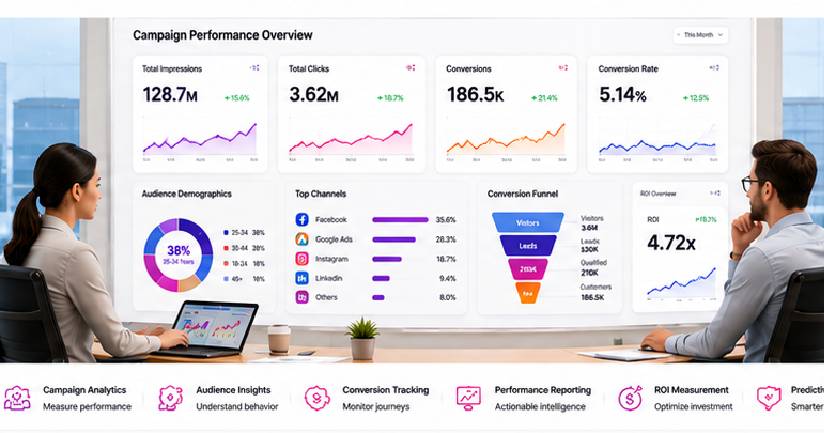
Marketing Dashboard & KPI Reporting transforms information from multiple marketing and business systems into organized visual reporting environments.
The architecture becomes:
Marketing Systems → Customer Systems → Advertising Platforms → Business Data → Data Integration → KPI Framework → Dashboard → Executive Reporting → Decision
Instead of requiring leadership to review separate reports from multiple teams and platforms, Brand Messenger can create a more connected performance view.
Marketing Dashboard & KPI Reporting Is Different from Marketing Analytics
These services are closely related, but they have different purposes.
Marketing Analytics
Marketing Analytics investigates data to understand:
What happened?
Why might performance have changed?
What patterns exist?
How do audiences behave?
What relationships appear in the data?
Where should deeper investigation occur?
Marketing Dashboard & KPI Reporting
Dashboard & KPI Reporting focuses on:
What should management monitor?
What is current performance?
Are targets being met?
What has materially changed?
Where does leadership need attention?
How should performance be communicated?
Therefore:
Analytics Investigates Performance.
Dashboards Communicate and Monitor Performance.
Marketing Dashboard & KPI Reporting Is Different from Attribution
This distinction is also important.
Attribution
Attempts to evaluate how marketing or advertising interactions contribute to conversions or outcomes.
Dashboard & KPI Reporting
Organizes and communicates performance information across multiple dimensions—including attribution results where appropriate.
The relationship becomes:
Attribution → Measurement Output → Dashboard → Executive Understanding
Attribution can therefore feed a dashboard without the dashboard itself becoming an attribution model.
Marketing Dashboard & KPI Reporting Is Different from Customer Journey Analytics
Customer Journey Analytics examines:
Touchpoints → Paths → Drop-Off → Conversion Journeys
Marketing Dashboard & KPI Reporting can present selected journey KPIs alongside other business and marketing indicators.
For example:
Journey Analytics calculates journey completion and drop-off.
Executive Dashboard presents those measures alongside acquisition, revenue, retention and ROI.
Brand Messenger Marketing Dashboard & KPI Reporting Services
Our capabilities can include:
Marketing Dashboard Strategy
KPI Framework Development
Executive Marketing Dashboards
CMO Dashboards
Management Dashboards
Live Dashboards
Near-Real-Time Dashboards where supported
Marketing Performance Dashboards
Advertising Performance Dashboards
Paid Media Dashboards
Campaign Dashboards
Channel Dashboards
Social Media Dashboards
Content Marketing Dashboards
SEO Performance Dashboards
Email Marketing Dashboards
CRM Dashboards
Customer Dashboards
E-Commerce Dashboards
Revenue Marketing Dashboards
Lead Generation Dashboards
Funnel Dashboards
Customer Journey Dashboards
Customer Lifetime Value Dashboards
Retention Dashboards
Loyalty Dashboards
Event Marketing Dashboards
Retail Marketing Dashboards
Multi-Channel Dashboards
Omnichannel Reporting
Multi-Brand Reporting
Multi-Market Reporting
Multi-Location Reporting
Executive Reports
Board-Level Marketing Reports
KPI Monitoring
Target Monitoring
Goal Tracking
Marketing ROI Reporting
ROAS Reporting
Budget & Spend Reporting
Campaign Performance Reporting
Revenue Reporting
Customer Acquisition Reporting
Customer Value Reporting
Performance Visualization
Trend Visualization
Funnel Visualization
Journey Visualization
Geographic Performance Visualization
Comparative Performance Reporting
Automated Reporting
Scheduled Reports
Performance Alerts
Exception Reporting
AI-Assisted Reporting
Executive Summaries
Data Integration
Dashboard Governance
KPI Governance
Data Quality Monitoring
Role-Based Dashboard Access
Continuous Reporting Optimization
Live Marketing Dashboards
See Marketing Performance as It Changes
Static monthly reports can be useful for historical review.
But many marketing teams also need faster visibility into:
Campaign Spend
Leads
Conversions
Revenue
Acquisition Cost
Customer Activity
Campaign Delivery
Budget Pacing
Brand Messenger can create connected dashboard environments that update according to the frequency supported by underlying data sources and integrations.
The model becomes:
Data Sources → Integration → Processing → Dashboard → Current Performance View
What Does “Live” Mean?
Not every marketing system updates continuously.
Depending on the source, information may update:
In Real Time
Near Real Time
Hourly
Daily
Periodically
Brand Messenger should define dashboard freshness according to the actual connected systems rather than using “real-time” as a generic claim.
A Dashboard Should Clearly Communicate How Current Its Data Actually Is.
Marketing Command Dashboard
A central marketing dashboard can bring together:
Media
Spend • Reach • Traffic • Campaign Performance
Demand
Leads • MQLs • SQLs • Opportunities
Customer
Acquisition • Retention • CLV
Revenue
Pipeline • Sales • Revenue • ROI
Experience
Conversion • Journey • Engagement
This creates a broader marketing-performance environment.
Executive Marketing Dashboards
Give Leadership the Information Needed to Make Decisions
Executives generally do not need hundreds of campaign metrics.
They need clarity.
A Brand Messenger executive dashboard can focus on questions such as:
How much are we investing?
What business outcomes are being generated?
Are we on target?
Which areas materially changed?
How is customer acquisition performing?
What is happening to retention?
How is customer value developing?
Where should management investigate?
The principle is:
Less Reporting Noise. More Decision-Relevant Intelligence.
CMO Dashboard
A CMO-level dashboard can consolidate:
Marketing Investment
Budget • Spend • Budget Utilization
Customer Acquisition
Leads • Customers • CAC
Marketing Performance
Conversions • Revenue • ROI • ROAS
Customer Growth
Retention • Repeat Purchase • CLV
Brand & Engagement
Reach • Engagement • Relevant Brand Indicators
Journey
Conversion Paths • Funnel Progression • Drop-Off
Executive Alerts
Material Changes • Target Variances • Emerging Issues
CEO & Executive Management View
A CEO may require an even more focused perspective.
Potential indicators can include:
Marketing Investment → Customer Acquisition → Pipeline / Revenue → Customer Retention → Customer Lifetime Value → Marketing ROI
The dashboard translates marketing activity into business language.
Board-Level Marketing Reporting
Board reporting often requires a higher-level strategic view.
Brand Messenger can structure reports around:
Marketing Investment
Growth
Customer Acquisition
Customer Economics
Market Development
Revenue Contribution
Strategic Initiatives
Performance Against Plan
Major Risks / Variances
Forward Priorities
The objective is not to reproduce an operational campaign dashboard for the board.
Different audiences require different reporting depth.
Executive Reports
Translate Marketing Complexity into Clear Business Communication
Brand Messenger can create recurring executive reports that combine:
Performance Data
KPI Status
Trend Analysis
Key Changes
Management Commentary
Priorities
The report can answer:
What Happened?
Performance summary.
What Changed?
Material movement compared with an appropriate period or target.
What Requires Attention?
Exceptions or significant deviations.
What Should Be Investigated Next?
Areas requiring deeper analysis.
Daily Marketing Reports
For high-volume marketing environments, daily reporting can focus on:
Spend
Budget Pacing
Leads
Conversions
Revenue
Major Campaign Changes
Performance Alerts
Not every enterprise requires daily executive reporting.
Frequency should match decision needs.
Weekly Marketing Reports
Weekly reporting can provide a useful operational-management rhythm.
Potential structure:
Performance Summary
Channel Performance
Campaign Performance
Lead / Revenue Performance
Budget
Customer KPIs
Issues
Actions
Monthly Executive Marketing Reports
Monthly reporting can provide a broader strategic perspective:
Monthly Performance → Target Comparison → Previous-Period Comparison → Customer & Revenue Performance → ROI → Key Insights → Management Priorities
This can become a consistent enterprise reporting framework.
Quarterly Marketing Performance Reports
Quarterly reports can examine longer-term:
Trends
Customer Growth
Marketing Efficiency
CLV
Retention
Channel Development
Strategic Initiatives
Budget Performance
Quarterly reporting can help reduce overreaction to short-term fluctuations.
KPI Monitoring
Define What Matters Before Building the Dashboard
A dashboard is only as useful as the KPIs it monitors.
Brand Messenger can help organizations distinguish between:
Data
Metrics
and
Key Performance Indicators
Not every available metric is a KPI.
A KPI should connect with an important business or marketing objective.
Marketing KPI Framework
The architecture can become:
Business Objective → Marketing Objective → Strategy → KPI → Metric → Target → Dashboard → Decision
This keeps reporting aligned with business priorities.
Marketing Investment KPIs
Potential indicators can include:
Marketing Budget
Advertising Spend
Budget Utilization
Cost per Campaign
Media Investment
Spend by Channel
These show where marketing resources are being deployed.
Customer Acquisition KPIs
Potential indicators can include:
Leads
Qualified Leads
Customers Acquired
Customer Acquisition Cost
Lead-to-Customer Conversion
Acquisition by Channel
The exact KPI set should reflect the organization's business model.
Campaign KPIs
Campaign dashboards can monitor:
Reach
Impressions
Clicks
Engagement
Leads
Conversions
Revenue
CPA
ROAS
Not every metric should be given equal executive importance.
Funnel KPIs
For revenue marketing:
Visitors → Leads → MQL → SQL → Opportunity → Customer
Potential KPIs include:
Stage Volume
Stage Conversion
Drop-Off
Pipeline
Revenue
This connects marketing activity with commercial outcomes.
Customer Journey KPIs
Brand Messenger can bring selected Customer Journey Analytics indicators into executive dashboards.
These can include:
Journey Completion
Drop-Off
Conversion Path Length
Time to Conversion
Stage Progression
The detailed journey analysis remains within the Customer Journey Analytics service.
Customer Retention KPIs
Potential indicators include:
Customer Retention
Repeat Purchase
Renewal
Churn
Reactivation
This moves executive reporting beyond acquisition.
Customer Lifetime Value KPIs
Brand Messenger can connect Customer Lifetime Value Optimization with dashboard reporting.
Potential indicators include:
Historical CLV
Predicted CLV where appropriately modeled
Customer Value by Segment
High-Value Customer Trends
CLV-to-CAC Relationship
Repeat Purchase
This helps leadership understand longer-term customer economics.
First-Party Data KPIs
For organizations developing their First-Party Data Strategy, dashboards can monitor appropriate indicators such as:
Known Customer Base
CRM Data Quality
CDP Profile Coverage
First-Party Audience Development
Customer Preference Status
Customer Data Activation
This can turn first-party data development into a measurable enterprise initiative.
KPI Targets
KPIs become more useful when connected with targets.
The architecture becomes:
Actual Performance ↔ Target Performance
Potential status views can include:
On Target
Above Target
Below Target
Requires Investigation
Thresholds should reflect actual business objectives rather than generic benchmarks.
KPI Variance Analysis
Brand Messenger can show:
Actual − Target = Variance
or:
Current Period ↔ Previous Period: This helps management quickly identify meaningful changes.
Trend Monitoring
A single KPI number can be misleading.
For example:
Conversion Rate: 4.2%
Without context, management does not know whether this is:
Increasing
Declining
Stable
Seasonal
Above Target
Below Target
Trend visualization adds that context.
Performance Trends
Dashboards can visualize:
Day → Week → Month → Quarter → Year
depending on reporting requirements.
This helps distinguish temporary volatility from sustained movement.
ROI Reporting
Connect Marketing Investment with Business Outcomes
Marketing ROI reporting helps management evaluate the economic relationship between marketing investment and measured business returns.
A simplified conceptual formula can be:
(Return Attributed to Marketing − Marketing Cost) ÷ Marketing Cost
However, organizations may define marketing ROI differently depending on:
Revenue
Gross Margin
Incremental Value
Marketing Costs
Attribution Methodology
Brand Messenger can help establish a consistent enterprise definition.
ROI Is Different from ROAS
These terms are often confused.
ROAS
Typically focuses on:
Advertising Revenue ÷ Advertising Spend
Marketing ROI
Can take a broader perspective incorporating:
Marketing Return relative to Marketing Investment: Depending on the organization's methodology, ROI may consider costs beyond media spend.
Therefore:
ROAS Measures Advertising Efficiency.
Marketing ROI Can Measure Broader Marketing Economics.
ROI Reporting + Attribution
ROI depends on how marketing outcomes are connected with marketing activity.
Therefore:
Attribution / Measurement → Contribution Estimate → Financial Data → ROI Reporting
Brand Messenger should clearly document the measurement assumptions used.
ROI Reporting + Incrementality
Where reliable experimental or causal measurement exists, incremental outcomes can strengthen ROI analysis.
The question becomes:
What business outcome occurred?
versus:
What additional outcome appears to have occurred because of the marketing activity?
Incrementality methods have their own assumptions and limitations and should be reported accordingly.
Campaign ROI Reporting
Brand Messenger can provide ROI views by:
Campaign
Product
Market
Customer Segment
Business Unit
where the necessary financial and measurement information exists.
Channel ROI Reporting
Potential channel views can include:
Paid Search
Paid Social
Programmatic
Display
Video
Events
Other Marketing Channels
Comparisons should account for the fact that different channels may play different roles across the customer journey.
Marketing Cost Reporting
A broader ROI framework may include appropriate costs such as:
Media
Creative
Technology
Agency / Service
Campaign Production
Event Costs
The organization should define consistently which costs are included.
Revenue Reporting
Connect Marketing Performance with Commercial Outcomes
Brand Messenger can connect marketing dashboards with appropriate:
E-Commerce Revenue
CRM Revenue
Pipeline
Closed Sales
Subscription Revenue
Renewals
The architecture becomes:
Marketing → Customer → CRM / Commerce → Revenue → Dashboard
This helps leadership move beyond clicks and impressions.
Pipeline Reporting
For B2B organizations:
Lead → MQL → SQL → Opportunity → Pipeline → Closed Business
Brand Messenger can visualize the relationship between marketing and sales pipeline.
This requires consistent definitions between marketing and sales teams.
Marketing-Sourced vs. Marketing-Influenced Reporting
Organizations may distinguish between:
Marketing-Sourced: Opportunities or customers whose defined acquisition source is marketing.
Marketing-Influenced
Opportunities or customers with relevant marketing interactions somewhere within the journey.
These definitions should be documented carefully to avoid overstating marketing contribution.
Performance Visualization
Make Complex Marketing Information Easier to Understand
Data visualization can transform large tables of numbers into patterns that decision-makers can interpret more quickly.
Brand Messenger can create:
KPI Cards
Trend Charts
Funnel Visualizations
Journey Flows
Performance Comparisons
Budget Visualizations
Geographic Views
Customer Segment Views
Revenue Trends
CLV Trends
Campaign Performance Views
The purpose of visualization is clarity not decoration.
KPI Scorecards
An executive scorecard can present:
KPI | Actual | Target | Variance | Trend | Status: This allows management to review performance quickly.
Funnel Visualization
For example:
100,000 Visitors → 10,000 Leads → 3,000 Qualified Leads → 1,000 Opportunities → 300 Customers
A visual funnel can help management see where volume changes across the commercial journey.
Customer Journey Visualization
Customer Journey Analytics can feed visual journey reporting such as:
Ad → Website → Content → Email → Product → Conversion
with:
Journey Volume
Drop-Off
Time
Conversion
This provides an executive-level view without replacing detailed journey analysis.
Budget Visualization
Brand Messenger can visualize:
Approved Budget
versus
Actual Spend
versus
Remaining Budget
alongside:
Pacing
Performance
Forecast
This connects reporting with Budget & Bid Optimization.
Campaign Performance Visualization
Campaigns can be compared across appropriate measures such as:
Spend
Conversions
CPA
Revenue
ROAS
This helps teams identify where deeper analysis may be required.
Geographic Performance Visualization
Multi-market organizations can compare performance across:
Countries
Regions
Cities
Stores
Branches
Markets
Differences should be interpreted alongside market size, pricing, investment and local conditions.
Multi-Brand Marketing Dashboards
Enterprise organizations may manage multiple brands.
Brand Messenger can structure:
Enterprise → Brand A
Brand B
Brand C
↓
Channels
↓
Campaigns
Leadership can move between consolidated and brand-level views.
Multi-Market Dashboards
Global and regional organizations may require:
Global View → Region → Country → Market → Campaign
This creates a reporting hierarchy appropriate for distributed enterprises.
Multi-Location Dashboards
Retail, hospitality, healthcare and other location-based organizations can compare:
Enterprise → Region → Location → Performance
Potential indicators can include:
Marketing Activity
Customer Acquisition
Revenue
Retention
Campaign Performance
Role-Based Dashboards
Different Teams Need Different Views
A CEO, CMO, campaign manager and analyst should not necessarily see the same dashboard.
Brand Messenger can create role-based views.
Executive
Business Outcomes • ROI • Growth • Customer Economics
CMO
Marketing Investment • Acquisition • Campaigns • Customer Growth
Marketing Manager
Channels • Campaigns • Leads • Conversions
Performance Team
Spend • Bids • CPA • ROAS • Campaign Delivery
CRM Team
Customers • Lifecycle • Retention • CLV
Analyst
Detailed Data • Trends • Segments • Journeys
The underlying data can remain connected while presentation changes according to decision need.
Executive Summary Layer
A sophisticated dashboard can include a concise management summary answering:
What Changed?
What Matters?
What Requires Attention?
What Should Be Investigated?
This can reduce the time executives spend interpreting complex reports.
AI-Assisted Executive Reporting
Use AI to Help Interpret Large Volumes of Marketing Data
AI can assist reporting by identifying:
Material KPI Changes
Unusual Performance
Emerging Trends
Significant Variances
Potential Areas for Investigation
The architecture becomes:
Marketing Data → KPI Engine → AI Analysis → Executive Summary → Human Review
AI-generated interpretations should be reviewed before being treated as definitive business conclusions.
Automated Marketing Reports
Brand Messenger can automate recurring report generation where appropriate.
For example:
Connected Data → Dashboard → Scheduled Report → Management
Reports can be delivered according to operational needs such as:
Daily
Weekly
Monthly
Quarterly
Automation reduces repetitive manual reporting work.
Automated Executive Summaries
AI-assisted systems can draft summaries such as:
“Paid-media spend increased while acquisition volume remained relatively stable.”
or:
“Retention declined compared with the previous reporting period and warrants further analysis.”
The wording should distinguish measured facts from hypotheses about why changes occurred.
Performance Alerts
Move from Passive Reporting to Active Monitoring
Management should not always need to open a dashboard to discover a material issue.
Brand Messenger can structure alerts around defined conditions such as:
Budget Overspend
Sudden Conversion Decline
Revenue Change
CPA Increase
ROAS Change
Lead Volume Decline
Tracking Failure
KPI Threshold Breach
The model becomes:
Data → KPI → Threshold → Alert → Investigation
Exception Reporting
Instead of reporting every metric equally, exception reporting focuses attention on material changes.
For example:
50 KPIs Monitored → 4 Material Variances → Executive Attention
This can make reporting more useful for senior management.
Anomaly Detection
AI or statistical methods can identify unusual changes in performance.
Potential examples:
Unexpected Spend Spike
Sudden Traffic Drop
Unusual Conversion Change
Revenue Anomaly
An anomaly does not automatically explain why the change occurred.
It is a signal for investigation.
KPI Monitoring + Targets
Brand Messenger can connect:
KPI → Target → Actual → Variance → Trend → Alert
This creates a complete performance-monitoring framework.
KPI Monitoring + Forecast
Where appropriate forecasting exists, dashboards can show:
Actual Performance
versus
Target
versus
Forecast
This helps management understand not only where performance stands but where it may be heading.
Forecasts remain estimates.
Budget & Bid Optimization Dashboard
Brand Messenger can integrate its Budget & Bid Optimization service into executive reporting.
Potential views include:
Total Advertising Budget
Current Spend
Budget Utilization
Campaign Pacing
CPA
ROAS
Scaling Status
Forecast Spend
This gives management financial visibility into paid advertising.
Attribution Reporting
Brand Messenger's Advertising Measurement & Attribution outputs can feed executive dashboards.
Potential views can include:
Channel Contribution
Campaign Contribution
Conversion Attribution
Multi-Touch Analysis
Attribution methodology and limitations should be clearly documented.
Customer Journey Reporting
Customer Journey Analytics can feed:
Journey Completion
Drop-Off
Conversion Paths
Journey Duration
Touchpoint Volume
into the broader executive marketing dashboard.
CLV Reporting
Customer Lifetime Value Optimization can feed:
Historical CLV
Predictive CLV where appropriate
Customer Value Segments
Retention
Repeat Purchase
CLV-to-CAC
into management reporting.
This helps leadership connect acquisition with long-term customer economics.
First-Party Data Reporting
Brand Messenger's First-Party Data Strategy can provide executive indicators around:
CRM Customer Base
CDP Development
Customer Profiles
First-Party Audiences
Customer Preferences
Data Quality
This helps leadership monitor the development of customer-data capabilities.
CRM Dashboard Integration
CRM information can provide:
Leads
MQLs
SQLs
Opportunities
Pipeline
Customers
Revenue
The dashboard can therefore extend beyond top-of-funnel marketing metrics.
CDP Dashboard Integration
A CDP can contribute:
Customer Profiles
Audience Segments
Customer Activity
Journey Data
Activation Information
This can provide a stronger customer-centered reporting layer.
Marketing Automation Reporting
Marketing Automation can provide:
Workflow Activity
Campaign Engagement
Nurture Progression
Lifecycle Movement
Customer Communication
These can be integrated into broader marketing reporting.
E-Commerce Dashboard Integration
Commerce systems can contribute:
Transactions
Revenue
Orders
Average Order Value
Repeat Purchase
Product Performance
Customer Value
This connects marketing activity with commercial outcomes.
AdTech Reporting Integration
Brand Messenger can consolidate relevant information from its wider AdTech environment:
Programmatic Advertising
Paid Media
Ad Serving
Dynamic Creative
Retargeting
Budget & Bid Optimization
Advertising Measurement
The result can be a consolidated paid-media performance dashboard.
MarTech Reporting Integration
The MarTech layer can connect:
CRM
CDP
Marketing Automation
Customer Journey
Personalization
Content
Lead Management
Loyalty
Customer Intelligence
into broader marketing-performance reporting.
AI Marketing Intelligence + Dashboards
Brand Messenger's AI Marketing Intelligence can contribute:
Audience Patterns
Customer Behavior
Predictive Indicators
Journey Intelligence
Customer Trends
to executive reporting where appropriate.
AI insights should be clearly distinguished from directly measured KPIs.
Retail Marketing Dashboards
For retail organizations, dashboards can combine:
Campaigns + Commerce + Customer + Store + Loyalty
Potential indicators include:
Customer Acquisition
Store / Digital Sales
Repeat Purchase
Loyalty
Campaign Performance
Customer Value
Appropriate aggregated physical-space intelligence may also be incorporated where useful.
Face Signatures + Marketing Dashboards
For suitable retail, event and physical-space environments, Face Signatures by Messenger2050 Technologies can provide an additional supporting intelligence layer.
Potential aggregated indicators may include:
Visitor Traffic
Return-Visit Trends
Audience Flow
Zone Engagement
Event Activity
Location Performance
These signals can be integrated into Brand Messenger dashboards alongside digital marketing and business information.
Individual identity is not necessary for many executive reporting objectives, so aggregated intelligence should generally be preferred where it meets the business need.
Smart Event Dashboards
Brand Messenger's Smart Event Technology can feed executive reporting around:
Registrations
Attendance
Sessions
Exhibitor Engagement
Audience Activity
Lead Generation
Post-Event Outcomes
This can connect event performance with wider marketing and customer reporting.
Marketing Dashboard Data Architecture
A broader enterprise architecture can become:
Advertising Platforms
Website / App Analytics
CRM
CDP
Marketing Automation
Commerce
Customer Service
Loyalty
Events / Retail Intelligence Where Appropriate
↓
Data Integration Layer
↓
Marketing Data Model
↓
KPI Calculation Layer
↓
Marketing Intelligence
↓
Dashboard & Visualization Layer
↓
Executive Reporting
↓
Decision & Action
Data Integration
Dashboards may require information from multiple systems through:
APIs
Data Connectors
Webhooks
Data Warehouses
Data Pipelines
Scheduled Imports
Business Intelligence Systems
The integration architecture depends on the organization's technology environment.
Single Source of Reporting Truth
A common enterprise challenge is:
Marketing says revenue is $2.1M.
Sales says $1.8M.
Finance says $1.6M.
Often, the difference comes from definitions rather than the visualization itself.
Brand Messenger can help establish:
Metric Definition → Authoritative Data Source → Calculation → Dashboard
The goal is not necessarily one database for everything.
It is:
One Agreed Definition for Every Important KPI.
KPI Dictionary
Brand Messenger can create an enterprise KPI dictionary defining:
KPI Name
Business Definition
Formula
Data Source
Owner
Update Frequency
Target
Reporting Level
For example:
Customer Acquisition Cost: Definition: Agreed cost of acquiring a new customer.
Data Sources: Marketing Spend + Customer Acquisition Data.
Reporting Frequency: Monthly.
This helps prevent departments from calculating the same KPI differently.
KPI Ownership
Important KPIs should have defined ownership.
For example:
Media Spend → Performance Marketing
Pipeline → Sales / Revenue Operations
Revenue → Finance / Commerce
CLV → Customer / Analytics
Clear ownership helps maintain reporting reliability.
Dashboard Data Quality
Beautiful Visualization Cannot Fix Incorrect Data
Before executive reporting, Brand Messenger can evaluate:
Missing Data
Duplicate Events
Incorrect Conversion Definitions
CRM Inconsistencies
Currency Differences
Time-Zone Differences
Attribution Differences
Revenue Definitions
Data Delays
The principle is:
Trust the Dashboard Only When You Can Trust the Data Behind It.
Data Freshness Indicators
Dashboards can show when information was last updated.
For example:
Advertising Data — Updated 15 Minutes Ago
CRM — Updated Hourly
Finance — Updated Daily
This helps users understand what “current performance” actually means.
Dashboard Governance
Enterprise dashboards require governance around:
KPI Definitions
Data Sources
Access
Ownership
Changes
Version Control
Reporting Frequency
Quality Assurance
A dashboard should not become an uncontrolled collection of calculations created independently by different teams.
Role-Based Access
Different dashboard users may require different levels of access.
For example:
Board
Enterprise Summary
CEO
Business & Marketing Outcomes
CMO
Full Marketing Performance
Marketing Manager
Campaign & Channel Performance
Analyst
Detailed Data
Access should reflect business need and data sensitivity.
Privacy-Aware Marketing Reporting
Dashboards should generally use aggregated information where individual customer identity is unnecessary.
Executive reporting rarely requires exposing:
Customer Names
Personal Contact Details
Individual Behavioral Histories
Sensitive Personal Data
The principle is:
Report the Intelligence Needed for the Decision not Every Piece of Customer Data Available.
Marketing ROI Requires Clear Assumptions
Marketing ROI can become misleading if organizations combine inconsistent:
Costs
Revenue
Attribution
Time Periods
Margin Definitions
Brand Messenger can document the methodology used so decision-makers understand what the reported ROI represents.
Dashboards Should Not Imply Causation Automatically
Suppose:
Marketing Spend Increased
and
Revenue Increased
during the same period.
A dashboard can accurately show both.
It should not automatically conclude:
The additional marketing spend caused the entire revenue increase.
Deeper attribution, experimentation or incrementality analysis may be required.
AI Reporting Requires Human Review
AI can summarize and identify patterns.
However, automated commentary can misinterpret:
Seasonality
Business Events
Tracking Changes
Promotions
Pricing Changes
External Market Conditions
Brand Messenger can use AI as an intelligence assistant while keeping appropriate human review in the reporting process.
Marketing Dashboard Maturity Model
Organizations can develop reporting progressively.
Level 01 — Manual Reporting
Spreadsheets • Platform Reports • Monthly Compilation
Level 02 — Connected Dashboards
Automated Data Sources • Channel Dashboards • KPI Monitoring
Level 03 — Executive Marketing Intelligence
CMO Dashboard • ROI • Customer Acquisition • Revenue
Level 04 — Customer & Revenue Intelligence
CRM + CDP + Journey + CLV + Retention + Revenue
Level 05 — AI-Assisted Marketing Intelligence
Anomaly Detection • Executive Summaries • Forecasts • Alerts
Level 06 — Enterprise Marketing Command Environment
Marketing + Advertising + Customer + Revenue + Finance + AI + Executive BI
The goal is not maximum dashboard complexity.
It is:
Maximum Decision Clarity.
Complete Brand Messenger Marketing Dashboard & KPI Reporting Process
A comprehensive engagement can follow:
Business Objectives → Executive Reporting Requirements → Marketing Objectives → Stakeholder & Role Analysis → Existing Reporting Audit → Data Source Assessment → KPI Definition → KPI Dictionary → Target & Benchmark Framework → Data Integration Architecture → Data Quality Validation → Dashboard Information Architecture → Executive Dashboard Design → Operational Dashboard Design → Performance Visualization → ROI Reporting Framework → Automated Reporting → Alerts & Exception Reporting → Access & Governance → Testing & Validation → Deployment → Executive Adoption → Continuous Reporting Optimization
The lifecycle becomes:
Connect → Define → Measure → Visualize → Monitor → Explain → Decide → Act → Review
Across the Brand Messenger Marketing Intelligence Ecosystem
Marketing Dashboard & KPI Reporting sits at the reporting and decision layer across Brand Messenger's wider ecosystem.
AdTech
Advertising & Media Performance
↓
MarTech
Marketing & Customer Operations → First-Party Data Strategy
Customer Data Foundation → CRM + CDP
Customer & Revenue Information → Audience Segmentation
Audience Intelligence → Customer Journey Analytics
Path & Drop-Off Intelligence → Customer Lifetime Value Optimization
Long-Term Customer Economics → Budget & Bid Optimization
Advertising Investment Intelligence → Advertising Measurement & Attribution
Contribution & Measurement → AI Marketing Intelligence
Patterns • Predictions • Decision Support → Marketing Dashboard & KPI Reporting
Live Dashboards • Executive Reports • KPI Monitoring • ROI Reporting • Performance Visualization → Executive Decision-Making
The complete reporting architecture becomes:
Data → Measurement → KPI → Visualization → Insight → Executive Understanding → Decision → Action
Industries & Organizations We Serve
Brand Messenger Marketing Dashboard & KPI Reporting can support:
Enterprise Organizations
Multi-Brand Groups
Global & Regional Businesses
E-Commerce
Retail
B2B
SaaS
Technology
Telecommunications
Financial Services
Hospitality
Travel
Automotive
Real Estate
Consumer Brands
Media
Entertainment
Events
Professional Services
Education
Healthcare
Subscription Businesses
Multi-Location Organizations
Marketing Agencies
Corporate Marketing Departments
Dashboard architecture, KPIs and reporting requirements should be designed around each organization's business model.
Benefits of Marketing Dashboard & KPI Reporting
Brand Messenger can help organizations:
Consolidate fragmented marketing reporting
Create live or appropriately refreshed dashboards
Build executive marketing dashboards
Create CMO reporting environments
Monitor critical marketing KPIs
Connect KPIs with business targets
Track KPI variances
Monitor marketing budgets
Visualize advertising performance
Connect marketing with CRM and revenue
Report marketing ROI
Distinguish ROI from ROAS
Integrate attribution outputs
Integrate Customer Journey Analytics
Report CLV and retention
Monitor customer acquisition
Visualize funnels
Track conversion paths
Compare campaigns and channels
Compare brands, markets and locations
Automate recurring reports
Create AI-assisted executive summaries
Detect unusual performance changes
Configure performance alerts
Build role-based dashboards
Establish KPI governance
Improve data consistency
Reduce manual reporting
Give management faster access to marketing intelligence
Why Choose Brand Messenger?
Brand Messenger combines Live Dashboards, Executive Reporting, KPI Monitoring, ROI Reporting, Performance Visualization, Marketing Analytics, Advertising Measurement, Attribution, Customer Journey Analytics, Customer Lifetime Value, First-Party Data, CRM, CDP, AdTech, MarTech and AI Marketing Intelligence within one connected reporting environment.
We do not approach executive marketing reporting as:
Collect Every Metric → Put Everything on a Dashboard → Give It to Management.
We approach it as:
Business Objective → Marketing Objective → Trusted Data → Defined KPI → Target → Performance → Visualization → Executive Insight → Decision.
The distinction matters.
Live Dashboards provide timely visibility into marketing performance.
Executive Reports translate complex marketing activity into business-level communication.
KPI Monitoring keeps teams focused on measures connected with actual objectives.
ROI Reporting connects marketing investment with measured economic outcomes.
Performance Visualization makes trends, comparisons, funnels and changes easier to understand.
Marketing Analytics provides the deeper investigation behind the numbers.
Attribution provides a separate methodology for analyzing contribution.
Customer Journey Analytics explains how customers move across touchpoints.
CLV Optimization adds the long-term customer-value perspective.
First-Party Data strengthens the underlying customer intelligence.
AI Marketing Intelligence can identify patterns, exceptions and potential areas requiring attention.
And the Marketing Dashboard brings selected information together for the people responsible for making decisions.
The result is not another report.
It is a marketing management and executive intelligence layer.
See the Performance. Monitor the KPIs. Understand the Return. Visualize What Matters. Turn Marketing Data into Executive Decisions.
Live Dashboards. Executive Reports. KPI Monitoring. ROI Reporting. Performance Visualization. One Connected Marketing Performance Intelligence Environment.