



AI Event Intelligence & Audience Analytics
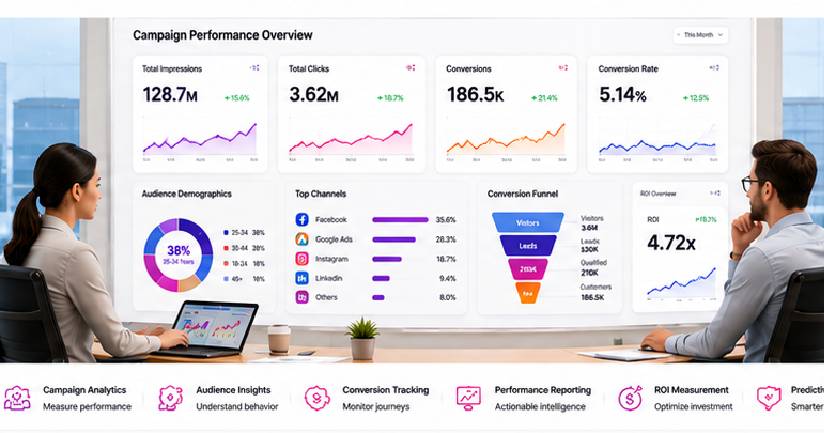
Understand the Audience. Measure the Experience. Analyze Visitor Movement. Turn Events into Actionable Intelligence.
Events generate far more than registrations and attendance numbers.
Every exhibition, conference, trade show, festival, corporate event, product launch, award ceremony, brand activation and experience venue creates patterns of visitor arrival, movement, dwell time, engagement, crowd density, zone activity, repeat visits and audience response.
The challenge is turning those signals into useful intelligence.
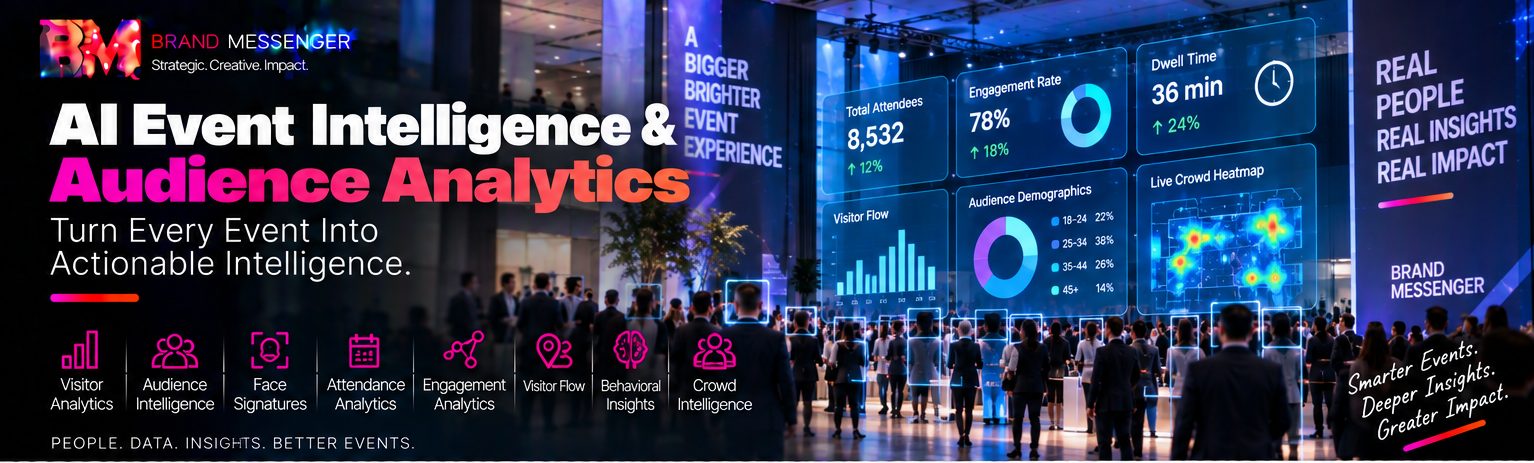
At Brand Messenger, our AI Event Intelligence & Audience Analytics service combines AI Event Intelligence, Face Signatures integration, visitor analytics, audience intelligence, attendance analytics, visitor-flow analysis, dwell-time measurement, engagement analytics, crowd intelligence and behavioral insights to help organizers, exhibitors, sponsors, venues and brands better understand what happens throughout the event experience.
Our core capabilities include:
AI Event Intelligence
Face Signatures Integration
Visitor Analytics
Audience Intelligence
Attendance Analytics
Visitor Flow Analytics
Dwell Time Analytics
Engagement Analytics
Crowd Intelligence
Behavioral Insights
Our wider capabilities can extend across entrance and exit analytics, zone analytics, booth and stand analytics, session analytics, venue utilization, movement patterns, repeat-visit analysis, peak-period analysis, queue intelligence, congestion analysis, exhibit engagement, sponsor analytics, activation analytics, audience segmentation, event dashboards, real-time operational intelligence, historical event comparison, predictive analytics, post-event reporting and executive business intelligence.
Our approach connects:
Event → Visitors → Attendance → Movement → Zones → Dwell → Engagement → Behavior → AI Analysis → Insights → Decisions → Event Improvement
The objective is not simply:
Count How Many People Attended.
It is:
Understand How Audiences Arrive, Move, Engage, Gather and Experience the Event and Turn Those Patterns into Better Event Decisions.
What Is AI Event Intelligence?
AI Event Intelligence applies artificial intelligence, computer vision, analytics and event data to help organizations understand audience and operational activity across physical event environments.
Traditional event reporting may tell an organizer:
10,000 People Attended.
Event intelligence asks deeper questions:
When did they arrive?
Which areas attracted the most activity?
Where did visitors spend more time?
Which booths or experiences generated engagement?
Where did crowds develop?
Which sessions or zones performed differently?
How did movement change throughout the day?
What happened after a campaign, presentation or activation?
The progression becomes:
Attendance → Movement → Engagement → Behavior → Intelligence → Action
From Event Management to Event Intelligence
Event Management focuses on delivering the event.
AI Event Intelligence helps understand what happens inside the event experience.
The architecture becomes:
Event Planning → Event Delivery → Visitor Activity → Event Data → AI & Analytics → Operational + Audience Intelligence → Event Decisions → Continuous Improvement
This makes Event Intelligence a powerful analytical layer within Brand Messenger's wider Event & Experiential Marketing ecosystem.
Brand Messenger AI Event Intelligence & Audience Analytics Services
Our capabilities can include:
AI Event Intelligence
Face Signatures Integration
Event Visitor Analytics
Audience Analytics
Attendance Analytics
Entry Analytics
Exit Analytics
Visitor Flow Analytics
Movement Analytics
Dwell Time Analytics
Zone Analytics
Engagement Analytics
Crowd Intelligence
Crowd Density Analytics
Behavioral Insights
Booth Analytics
Exhibition Stand Analytics
Sponsor Activation Analytics
Brand Activation Analytics
Session Analytics
Venue Analytics
Venue Utilization
Visitor Journey Analytics
Queue Analytics
Congestion Intelligence
Peak-Hour Analysis
Repeat-Visit Analytics
Returning Visitor Trends
Audience Segmentation
Location Performance
Exhibit Performance
Product Display Engagement
Interactive Experience Analytics
Event Campaign Analytics
Event Conversion Analytics
Real-Time Event Dashboards
Multi-Zone Dashboards
Sponsor Dashboards
Exhibitor Dashboards
Executive Event Dashboards
Historical Event Comparison
Multi-Day Event Analysis
Multi-Event Comparison
Predictive Event Analytics
AI-Assisted Event Insights
Post-Event Intelligence Reports
Event Performance Reporting
Event ROI Intelligence
Event Data Integration
CRM / CDP Integration
Marketing Automation Integration
Event Technology Integration
Face Signatures Integration
Add an AI-Powered Physical-Space Intelligence Layer to Event Analytics
Brand Messenger can integrate Face Signatures by Messenger2050 Technologies as an appropriate supporting technology within selected event intelligence environments.
Face Signatures can provide computer-vision and behavioral analytics capabilities that help transform physical-space activity into measurable event intelligence.
Depending on the deployment, technical configuration, permissions and event requirements, this can support analysis around:
Visitor Traffic
Movement Patterns
Zone Activity
Crowd Behavior
Repeat-Visit Trends
Engagement Patterns
Event Attendance
Physical-Space Analytics
This creates an important bridge between:
Physical Event Activity → Digital Event Intelligence
Face Signatures + Brand Messenger
Within this service:
Face Signatures: Provides the supporting AI / computer-vision intelligence layer where appropriate.
Brand Messenger
Transforms relevant event signals into:
Audience Intelligence
Marketing Intelligence
Event Analytics
Sponsor Insights
Exhibitor Intelligence
Operational Dashboards
Business Decisions
The relationship becomes:
Face Signatures → Physical-Space Signals → Brand Messenger Event Intelligence → Business Insights
Identity Is Not Required for Every Event Analytics Objective
Many useful event questions can be answered without identifying individual attendees.
For example:
How many visitors entered?
Which zone attracted more traffic?
Where did visitors spend more time?
When was the venue busiest?
Where did congestion occur?
Which exhibition areas generated greater activity?
For these applications, aggregated or non-identifying analytics may be sufficient.
Our principle is:
Use Identity When Identity Is Necessary. Use Aggregated Intelligence When It Is Enough.
Where identity, facial recognition or other biometric processing is proposed, deployment should be subject to appropriate purpose definition, notice, permissions or other lawful basis as applicable, security, retention controls and governance.
Visitor Analytics
Understand How People Use the Event Environment
Visitor Analytics provides a broader view of audience activity throughout an event.
Potential metrics can include:
Visitor Volume
Arrival Patterns
Departure Patterns
Peak Periods
Zone Visits
Movement
Dwell
Engagement
Repeat Visits
The objective is to transform:
Visitors
into:
Measurable Audience Patterns.
Visitor Traffic Analytics
Brand Messenger can analyze visitor activity by:
Entrance
Venue
Hall
Floor
Zone
Booth
Exhibition Area
Experience Area
where appropriate data is available.
This helps organizers understand how traffic is distributed across the event.
Visitor Journey Analytics
An event visitor may move through:
Entrance → Registration → Exhibition Hall → Booth → Session → Networking → Activation → Exit
Visitor Journey Analytics can help understand how audiences move between these experiences.
The architecture becomes:
Arrival → Movement → Experience → Engagement → Departure
Audience Intelligence
Move Beyond Attendance Numbers to Understand Audience Patterns
Audience Intelligence brings together event data to create a more useful picture of the audience.
Depending on available and appropriately collected data, this can include:
Visitor Segments
Engagement Levels
Attendance Patterns
Zone Preferences
Session Interests
Repeat Visits
Customer / Prospect Segments
Event Behavior
The objective is:
Understand Different Audience Groups and How They Experience the Event.
Audience Segmentation
Brand Messenger can segment event audiences according to appropriate factors such as:
Registration Type
Ticket Type
Customer Segment
Visitor Behavior
Session Engagement
Booth Engagement
Event Day
Visit Frequency
CRM Segment
This can help organizers understand whether different audience groups experience the event differently.
Attendance Analytics
Know More Than the Registration Number
Registration numbers do not necessarily equal actual attendance.
Brand Messenger can distinguish, where reliable data supports it:
Registered: vs.
Attended
vs.
Engaged
This creates a more useful event-performance view.
Registration-to-Attendance Analysis
The funnel can become:
Invited → Registered → Checked In → Attended → Engaged → Converted / Followed Up
This helps organizations understand the complete attendance journey.
Attendance by Time
Brand Messenger can analyze:
Arrival Time
Peak Entry Periods
Attendance by Hour
Attendance by Session
Attendance by Event Day
Departure Patterns
This can support operational planning for future events.
Multi-Day Attendance Analytics
For exhibitions, festivals and conferences running across multiple days:
Day 01 → Day 02 → Day 03
can be compared.
This can reveal:
Attendance Differences
Traffic Differences
Engagement Patterns
Repeat-Visit Trends
Peak Periods
Visitor Flow Analytics
Understand How Audiences Move Through the Event
Visitor Flow Analytics examines movement through physical event environments.
Potential areas can include:
Entrances
Corridors
Exhibition Halls
Booth Areas
Conference Rooms
Networking Zones
Food Areas
Experience Zones
Exits
The architecture becomes:
Entrance → Path → Zone → Interaction → Next Zone → Exit
Movement Pattern Analysis
Brand Messenger can analyze patterns such as:
Popular Routes
Underused Areas
High-Traffic Corridors
Movement Between Zones
Directional Flow
Bottlenecks
Transition Patterns
This can help improve future:
Venue Layout
Exhibition Planning
Signage
Wayfinding
Booth Placement
Activation Placement
Event Heatmaps
Aggregated movement and activity data can be visualized through event heatmaps.
Potential heatmaps can show:
High-Traffic Areas
Low-Traffic Areas
Engagement Zones
Crowd Concentration
Dwell Patterns
The principle is:
See How the Event Is Actually Used not Simply How It Was Designed to Be Used.
Dwell Time Analytics
Understand Where Audiences Choose to Spend Their Time
Traffic tells you:
People Were There.
Dwell time can add:
They Stayed There.
Brand Messenger can analyze appropriate dwell patterns across:
Booths
Exhibits
Brand Activations
Product Displays
Sessions
Experience Areas
Sponsor Areas
Networking Zones
Traffic + Dwell
These metrics should be interpreted together.
High Traffic + High Dwell
May indicate a strongly engaging area.
High Traffic + Low Dwell
May indicate a transit route or brief interaction.
Lower Traffic + High Dwell
May indicate a smaller but highly engaged audience.
Low Traffic + Low Dwell
May identify an area worth investigating.
These patterns are signals for analysis—not automatic explanations of visitor motivation.
Engagement Analytics
Measure How Audiences Interact with Event Experiences
Engagement can occur across:
Booths
Sessions
Displays
Product Demonstrations
Brand Activations
Interactive Installations
Networking Experiences
Digital Content
Brand Messenger can connect available engagement signals into a broader event intelligence framework.
Booth Engagement Analytics
For exhibitions and trade shows, Brand Messenger can analyze:
Booth Traffic
Dwell Time
Repeat Visits
Interactive Engagement
Lead / CRM Data where available
This creates a stronger view than simply counting booth visitors.
Exhibition Stand Analytics
Exhibitors can understand:
Visitor Traffic
Busy Periods
Engagement Duration
Repeat Activity
Lead Generation
Conversion where measurable
The architecture becomes:
Exhibition Traffic → Stand Visit → Engagement → Lead → Follow-Up → Opportunity
Brand Activation Analytics
Brand activations can be analyzed across:
Audience Traffic
Participation
Dwell
Interaction
Content Engagement
Lead Capture
Social Engagement
Conversion
This helps connect experiential marketing with measurable performance.
Product Display Analytics
For product launches, exhibitions and retail-style event environments, Brand Messenger can analyze:
Display Traffic
Product Zone Engagement
Dwell Patterns
Comparative Product Interest
Conversion / Lead Activity where measurable
Observed engagement indicates measurable behavior; it should not automatically be interpreted as proof of purchase intent.
Session Analytics
Understand How Audiences Engage with Event Programming
For conferences and summits, analytics can be structured around:
Session Attendance
Entry Patterns
Exit Patterns
Session Capacity
Dwell / Attendance Duration where measurable
Repeat Attendance Patterns
This can help organizers evaluate program performance.
Session Comparison
For example:
Session A
Attendance • Capacity • Engagement
Session B
Attendance • Capacity • Engagement
Session C
Attendance • Capacity • Engagement
This can support future programming decisions.
Crowd Intelligence
Understand Crowd Patterns to Support Better Event Operations
Crowd Intelligence can help organizers understand how groups of visitors gather and move throughout event spaces.
Potential analytics can include:
Crowd Density
Crowd Distribution
Congestion
Queue Development
Movement Patterns
Peak Periods
Zone Capacity Trends
The objective is to provide operational intelligence not to make unsupported claims about individual intentions.
Crowd Density Analytics
Brand Messenger can identify areas where crowd concentration increases.
This can support decisions around:
Venue Operations
Staffing
Wayfinding
Space Allocation
Queue Management
where appropriate.
Congestion Intelligence
A venue may experience:
Normal Flow → Increasing Density → Congestion
Analytics can help identify when and where these patterns occur.
Historical data can then inform future event design.
Queue Analytics
Queue intelligence can examine:
Queue Length Trends
Waiting Patterns
Peak Queue Periods
Location
Flow
This can be useful for:
Registration
Ticketing
Food Service
Product Experiences
Exhibitions
Entrances
Behavioral Insights
Turn Observed Event Activity into Useful Business Questions
Behavioral analytics can identify measurable patterns across:
Movement
Dwell
Repetition
Engagement
Zone Transitions
Session Attendance
These patterns can help organizations investigate:
What attracted attention?
Where did engagement weaken?
Which areas were repeatedly visited?
How did audience behavior change throughout the event?
Observed behavior should not be treated as direct evidence of a person's private thoughts or emotions.
Event Behavioral Analytics vs. Customer Intent
This distinction matters.
Behavioral Analytics
Observes measurable actions.
Intent
Is an interpretation or prediction about what someone may do next.
Therefore:
Behavior Creates Signals. Signals Support Analysis. Analysis Does Not Reveal a Person's Mind.
Zone Analytics
Measure Performance Area by Area
Large event environments can be divided into analytical zones.
For example:
Zone A — Registration
Zone B — Main Stage
Zone C — Exhibition
Zone D — Sponsor Area
Zone E — Networking
Zone F — Product Experience
Brand Messenger can compare traffic, dwell and engagement across these zones.
Zone Performance Scorecards
Each zone can be evaluated through appropriate indicators such as:
Visitor Volume
Dwell
Engagement
Peak Time
Repeat Visits
Conversion where measurable
This creates a venue-level performance framework.
Venue Intelligence
Understand How the Physical Event Environment Performs
Brand Messenger can combine:
Traffic + Flow + Dwell + Engagement + Crowd + Operational Data
to develop broader Venue Intelligence.
This can help answer:
Which spaces are underutilized?
Where does congestion develop?
Which areas attract visitors?
Which layouts support better flow?
Where should future activations be positioned?
Venue Utilization Analytics
For multi-room or multi-hall events:
Available Space → Actual Usage → Audience Activity
can be compared.
This helps organizers evaluate whether venue capacity is being used effectively.
Sponsor Intelligence
Give Sponsors Better Visibility into Event Performance
Sponsors increasingly want more than:
Logo Placement + Estimated Attendance.
Brand Messenger can develop sponsor analytics around appropriate measurable indicators such as:
Sponsored Zone Traffic
Activation Engagement
Dwell
Session Attendance
Lead Activity
Content Engagement
Campaign Interaction
The exact metrics depend on the sponsorship format.
Sponsor Dashboard
A sponsor dashboard can present:
Exposure
Relevant Audience Activity
Engagement
Activation / Booth / Content Interaction
Leads
Where appropriate and captured
Conversion
Where measurable
Performance
Campaign or sponsorship KPIs
This creates stronger sponsor reporting.
Exhibitor Intelligence
Exhibitors can receive analytics around:
Traffic → Engagement → Leads → Follow-Up → Opportunity
This can help move exhibition reporting beyond simple footfall.
Event Marketing Intelligence
AI Event Intelligence can connect with Brand Messenger's wider marketing ecosystem.
The architecture becomes:
Event Audience → Physical Engagement → Digital Engagement → CRM / CDP → Marketing Intelligence → Follow-Up Campaign → Customer Journey
This turns the event into a measurable part of the broader marketing lifecycle.
Physical + Digital Event Intelligence
Modern events often combine:
Physical Venue
Event App
Website
Registration Platform
Social Media
Interactive Displays
Livestream
CRM
Brand Messenger can bring appropriate data together.
The architecture becomes:
Physical Behavior + Digital Behavior + Registration + CRM + Campaign Data → Event Intelligence
Event Registration Data
Registration systems can provide valuable context such as:
Ticket Type
Registration Source
Event Day
Session Selection
Organization
Other Appropriately Collected Information
This can be connected with attendance and engagement analytics where appropriate.
Registration vs. Actual Behavior
A visitor may register for:
Session A
but actually spend more time in:
Exhibition Zone B.
Combining planned activity with observed activity can provide deeper event intelligence.
Event App Analytics
Where available, Brand Messenger can integrate:
App Usage
Agenda Interaction
Session Selection
Notifications
Digital Engagement
with broader event analytics.
Smart Badge Integration
Where events use smart badges or similar event technologies, appropriate interaction signals can potentially contribute to:
Check-In
Session Attendance
Zone Interaction
Networking
Lead Capture
depending on the deployed technology and permissions.
This connects with Brand Messenger's wider Smart Event Technology capabilities.
Interactive Exhibition Analytics
Interactive:
Kiosks
Touch Displays
Smart Screens
AR / VR
Digital Installations
can generate additional engagement signals.
Brand Messenger can connect these with audience analytics to understand how visitors interact with event technology.
AI Event Intelligence + Smart Event Technology
Brand Messenger's Smart Event Technology can provide:
AI Registration
Smart Badges
Interactive Exhibitions
Event Dashboards
Digital Event Experiences
AI Event Intelligence becomes the analytical layer connecting those technologies.
The relationship becomes:
Smart Event Technology → Event Data → AI Event Intelligence → Decision Support
Real-Time Event Intelligence
Understand What Is Happening During the Event—not Only After It Ends
Where appropriate systems support sufficiently timely data, Brand Messenger can create operational dashboards for:
Visitor Volume
Entry Activity
Zone Activity
Crowd Density
Queue Patterns
Session Activity
Venue Utilization
This can help event teams make better-informed operational decisions.
Real-Time vs. Near-Real-Time
Not every event system updates instantly.
Depending on:
Sensor
Camera
Platform
Network
Integration
Processing
data may be:
Real-Time
Near-Real-Time
Periodic
Post-Processed
Brand Messenger should clearly identify data freshness within dashboards.
Event Command Dashboard
A central event intelligence dashboard can combine:
Attendance
Visitors • Check-In • Peak Periods
Movement
Flow • Zones • Routes
Engagement
Booths • Sessions • Activations
Crowd
Density • Queues • Congestion
Marketing
Campaigns • Leads • Conversion
Operations
Venue • Capacity • Resource Indicators
This creates an integrated event intelligence environment.
AI-Assisted Event Intelligence
Use AI to Discover Patterns Across Complex Event Data
Brand Messenger can apply AI-assisted analytics to:
Visitor Patterns
Attendance Trends
Zone Performance
Dwell Patterns
Engagement
Crowd Patterns
Session Performance
Historical Comparisons
Anomaly Detection
Forecasting
The architecture becomes:
Event Data → AI Analysis → Pattern → Insight → Human Interpretation → Decision
AI Does Not Replace Event Management
AI can help identify:
Patterns
Trends
Anomalies
Relationships
But event teams remain responsible for:
Operational Decisions
Safety
Customer Experience
Commercial Decisions
Ethical Use
Governance
Our approach is:
AI Intelligence + Human Event Expertise.
Predictive Event Analytics
Use Historical and Current Signals to Prepare for What May Happen Next
Where sufficient reliable data exists, predictive analytics can support estimates around:
Attendance
Peak Arrival Periods
Crowd Development
Zone Demand
Session Demand
Visitor Traffic
The architecture becomes:
Historical Events + Current Registration + Current Activity → Predictive Model → Forecast
Forecasts remain estimates.
They should support planning not be treated as guarantees.
Attendance Forecasting
For example:
Registration Data + Historical Attendance Patterns + Event Timing
may help estimate attendance.
Actual outcomes can differ due to many external factors.
Crowd Forecasting
Historical flow and current activity may help identify potential periods or areas of increased crowd concentration.
This can support operational planning where appropriate systems and reliable data are available.
It should not replace required venue safety procedures or professional crowd-management responsibilities.
Event Anomaly Detection
AI systems can help flag unusual patterns such as:
Unexpected Traffic Changes
Sudden Zone Activity
Unusual Queue Development
Unexpected Attendance Variance
An anomaly is:
A Signal for Investigation not Automatically an Explanation of Cause.
Event Performance Comparison
Compare Events, Days, Locations and Experiences
Brand Messenger can compare:
Event A vs. Event B
or:
2026 Event vs. 2027 Event: across appropriate metrics.
Potential comparisons can include:
Attendance
Engagement
Dwell
Zone Performance
Session Performance
Leads
Conversion
Sponsor Performance
This can create a continuous learning system.
Multi-Location Event Intelligence
Organizations running:
Roadshows
Conferences
Exhibitions
Brand Activations
Product Launches
across multiple cities can compare:
City A → City B → City C
The dashboard can identify differences in:
Attendance
Engagement
Audience
Lead Generation
Event Performance
Event ROI Intelligence
Connect Event Activity with Business Outcomes
Event ROI should not be reduced to footfall alone.
Brand Messenger can connect:
Event Investment → Attendance → Engagement → Leads → Opportunities → Customers → Revenue
where reliable CRM and revenue data is available.
This creates a more complete event-performance framework.
Event ROI Is Not One Metric
Different events have different objectives.
A corporate conference may prioritize:
Qualified Leads
Customer Relationships
Pipeline
A consumer activation may prioritize:
Engagement
Product Trial
Purchases
A brand event may prioritize:
Awareness
Content
Audience Engagement
The KPI framework should reflect the event's actual business objective.
Event Lead Intelligence
For lead-generation events:
Visitor → Booth / Session → Lead → CRM → MQL → SQL → Opportunity → Customer
Brand Messenger can connect event activity with its Lead Management & Revenue Marketing capabilities.
Event Conversion Analytics
Potential conversions can include:
Lead Capture
Demo Request
Product Purchase
Registration
Appointment
Subscription
Follow-Up Meeting
The appropriate conversion depends on the event.
Event Intelligence + CRM
Event data can connect with CRM systems to support:
Lead Creation
Customer Profiles
Sales Follow-Up
Account Management
Opportunity Tracking
The architecture becomes:
Event Interaction → CRM → Sales / Marketing Journey → Customer Outcome
Event Intelligence + CDP
A Customer Data Platform can help connect event interactions with wider customer relationships.
The architecture becomes:
Event Data + Website + CRM + Campaign Data → CDP → Customer Intelligence
where appropriate and permitted.
Event Intelligence + First-Party Data Strategy
Events can generate valuable first-party customer relationships through:
Registration
Lead Capture
Surveys
Customer Interactions
Product Interest
Brand Messenger can connect these with its First-Party Data Strategy.
Customer permissions and intended data use should remain clear.
Event Intelligence + Marketing Automation
Post-event journeys can be triggered according to appropriate event interactions.
For example:
Attended Session → Relevant Follow-Up
Visited Product Booth → Product Information
Requested Demo → Sales Routing
Existing Customer → Account Follow-Up
This creates:
Event Engagement → Relevant Follow-Up → Customer Journey
Event Intelligence + Audience Segmentation
Event data can contribute to audience segmentation.
Potential segments can include:
Attendees
Non-Attendees
Session Participants
Booth Visitors
Highly Engaged Visitors
Returning Visitors
Leads
Customers
These segments can support future communication where appropriate.
Event Intelligence + Remarketing
Eligible event audiences can be re-engaged through Brand Messenger's Remarketing & Retargeting capabilities.
For example:
Event Registration / Engagement → Eligible Audience → Relevant Follow-Up Advertising
This can help continue the event journey after the physical experience ends.
Event Intelligence + Customer Journey Analytics
The event may represent only one stage in a broader journey.
For example:
Digital Ad → Event Registration → Physical Event → Booth → Website → Email → Demo → Customer
Brand Messenger's Customer Journey Analytics can help connect these touchpoints where reliable data is available.
Event Intelligence + Customer Lifetime Value
For customer-focused events:
Event Engagement → Customer Relationship → Repeat Purchase → Retention → CLV
can help organizations evaluate the longer-term value associated with event relationships.
This requires appropriate customer and revenue data.
Event Intelligence + Revenue Performance Marketing
Brand Messenger can connect:
Event Investment → Audience → Engagement → Lead → Customer → Revenue
This moves event measurement toward business performance.
Potential metrics can include:
Cost per Attendee
Cost per Engaged Visitor
Cost per Lead
Cost per Qualified Lead
Customer Acquisition Cost
Revenue
Customer Value
where measurable.
Event Intelligence + Brand Activations
Brand activations can combine:
Creative Experience + Physical Engagement + Audience Analytics + Digital Follow-Up
This provides a stronger measurement environment for experiential campaigns.
Event Intelligence + Exhibitions
For trade shows and exhibitions, Brand Messenger can create analytics across:
Venue → Hall → Zone → Booth → Visitor → Engagement → Lead
This can provide intelligence for:
Organizers
Exhibitors
Sponsors
Venue Operators
Event Intelligence + Conferences
Conference intelligence can connect:
Registration → Attendance → Session → Engagement → Networking → Lead / Customer Journey
This helps organizers understand programming and audience behavior.
Event Intelligence + Product Launches
For product launches:
Invite → Attendance → Product Experience → Engagement → Lead / Purchase → Follow-Up
can be measured where appropriate.
Event Intelligence + Awards & Ceremonies
For award shows and ceremonies, analytics can help understand:
Attendance
Arrival Patterns
Venue Flow
Audience Zones
Sponsor Areas
Experience Engagement
Brand Messenger can connect this intelligence with its broader event, media and production capabilities.
Event Intelligence + Festivals
Festivals can generate complex movement across:
Stages
Attractions
Food Areas
Sponsor Zones
Entry / Exit Points
Aggregated analytics can help understand how the event environment is used.
Event Intelligence + Retail Events
Retail activations can connect:
Visitor Traffic → Product Display → Engagement → Purchase
where appropriate commerce data is available.
This can connect event intelligence with Brand Messenger's Smart Retail Experiences capabilities.
Privacy-Aware Event Intelligence
Better Analytics Should Not Require Unnecessary Surveillance
Physical-space analytics requires careful governance.
Brand Messenger's approach is based on:
Defined Business Purpose
Appropriate Data Collection
Data Minimization
Transparency
Appropriate Notice
Consent or Other Applicable Legal Basis
Security
Access Controls
Retention Controls
Appropriate Anonymization / Aggregation
Biometric Governance where applicable
The principle is:
Understand Enough to Improve the Event Without Collecting More Personal Data Than the Purpose Requires.
Biometric & Identity Governance
Where Face Signatures or another technology is configured for identification or biometric processing, additional controls may be required depending on jurisdiction and use case.
These can include:
Defined Purpose
Appropriate Notice
Consent or Other Lawful Basis where applicable
Access Restrictions
Data Security
Retention Policy
Deletion Procedures
Vendor / Processor Governance
Human Oversight
Deployment requirements should be assessed for the specific jurisdiction and event.
Aggregated Event Intelligence
Many event-marketing objectives can use aggregated information.
For example:
Zone A received greater traffic than Zone B.
or:
Engagement increased during the afternoon.
These insights can be useful without identifying individual visitors.
Our principle remains:
Aggregated Intelligence First Where Individual Identity Is Not Necessary.
Event Analytics Does Not Automatically Explain Motivation
If visitors spend longer in one area, analytics can tell us:
Dwell Time Was Higher.
It cannot automatically prove:
Visitors Loved the Experience.
Similarly:
Higher Traffic
does not automatically mean:
Higher Customer Intent.
Brand Messenger distinguishes:
Observed Data → Interpretation → Hypothesis → Validation
This prevents dashboards from presenting assumptions as facts.
AI Event Intelligence Dashboard
A Brand Messenger dashboard can combine:
Attendance Intelligence
Registrations Check-Ins Attendance Peak Periods
Visitor Intelligence
Traffic Entries Exits Repeat Visits
Movement Intelligence
Visitor Flow Routes Zone Transitions
Engagement Intelligence
Dwell Booths Sessions Activations
Crowd Intelligence
Density Queues Congestion
Marketing Intelligence
Campaigns Leads Conversions
Commercial Intelligence
Opportunities Customers Revenue where measurable
Executive Event Dashboard
Senior management may require a simplified view:
Attendance → Engagement → Leads → Customers → Revenue / Business Outcome
supported by operational indicators such as:
Traffic • Dwell • Zones • Crowd • Sessions • Sponsors: This connects physical-event analytics with executive decision-making.
Sponsor & Exhibitor Reporting
Brand Messenger can create separate views for:
Organizer
Whole-Event Intelligence
Sponsor
Sponsored Experience Performance
Exhibitor
Booth & Lead Performance
Venue
Traffic & Utilization
Executive Team
Business Outcomes
This allows each stakeholder to receive information relevant to their role.
Post-Event Intelligence Report
After the event, Brand Messenger can produce an intelligence report covering areas such as:
Attendance
Visitor Traffic
Audience
Flow
Dwell
Engagement
Crowd
Zones
Booths
Sessions
Sponsors
Leads
Conversion
Performance Trends
Key Findings
Recommendations
This transforms event data into a practical planning resource.
AI Event Intelligence Maturity Model
Level 01 — Attendance Measurement
Registration → Check-In → Attendance
Level 02 — Visitor Analytics
Traffic + Flow + Dwell + Zones
Level 03 — Engagement Intelligence
Booths + Sessions + Activations + Audience Behavior
Level 04 — Connected Event Intelligence
Face Signatures + Smart Event Technology + CRM + CDP + Marketing Automation
Level 05 — Revenue-Connected Event Intelligence
Event → Lead → Opportunity → Customer → Revenue → CLV
Level 06 — AI-Powered Predictive Event Intelligence
Real-Time Data + Behavioral Analytics + Crowd Intelligence + Predictive Analytics + Executive BI
The objective is not simply to collect more event data.
It is:
Turn Relevant Event Data into Better Event, Audience, Marketing and Business Decisions.
Complete Brand Messenger AI Event Intelligence Process
A comprehensive engagement can follow:
Event Objective → Venue & Event Environment → Audience Journey → Measurement Requirements → Privacy & Governance Assessment → Technology Architecture → Face Signatures Integration where appropriate → Registration / Event Platform Integration → Visitor Analytics → Attendance Analytics → Visitor Flow → Dwell Time → Zone Analytics → Engagement Analytics → Crowd Intelligence → Behavioral Insights → CRM / CDP Integration → Lead & Customer Data → AI-Assisted Analysis → Real-Time / Near-Real-Time Dashboard where supported → Predictive Analytics where appropriate → Sponsor / Exhibitor Reporting → Revenue & ROI Intelligence → Post-Event Report → Recommendations → Next-Event Optimization
The lifecycle becomes:
Measure → Understand → Analyze → Predict → Decide → Improve
Across the Brand Messenger Event Intelligence Ecosystem
AI Event Intelligence connects with Brand Messenger's wider event, marketing and technology capabilities:
Event Strategy & Management
Design the Event → Smart Event Technology
Registration • Smart Badges • Interactive Experiences → Face Signatures by Messenger2050 Technologies
Physical-Space AI & Analytics Layer Where Appropriate → AI Event Intelligence & Audience Analytics
Visitors • Attendance • Flow • Dwell • Engagement • Crowd • Behavioral Insights → Audience Segmentation
Understand Different Audience Groups → CRM + CDP
Connect Event Engagement with Customer Relationships → Marketing Automation
Continue the Journey After the Event → Remarketing & Retargeting
Reconnect Eligible Event Audiences → Customer Journey Analytics
Connect Physical & Digital Touchpoints → Predictive Analytics
Add Forward-Looking Event Intelligence → Revenue Performance Marketing
Connect Event Activity with Business Outcomes → Customer Lifetime Value Optimization
Understand Long-Term Customer Relationships → Marketing Dashboard & KPI Reporting
Turn Event Data into Executive Intelligence
The complete architecture becomes:
Event → Audience → Attendance → Movement → Dwell → Engagement → Behavior → AI Intelligence → Lead / Customer → Revenue → Learning → Better Events
Events & Environments We Serve
Brand Messenger AI Event Intelligence & Audience Analytics can support appropriate applications across:
Conferences
Business Summits
Trade Shows
Exhibitions
Corporate Events
Product Launches
Brand Activations
Award Shows
Ceremonies
Film Festivals
Entertainment Events
Music Events
Festivals
Sports Events
Roadshows
Pop-Up Experiences
Experience Centers
Retail Events
Shopping-Mall Activations
Industry Events
Government Events
Educational Events
Fundraising Events
Networking Events
Multi-Day Events
Multi-City Events
Hybrid Events
The appropriate analytics architecture should reflect the venue, audience, event objective, available technologies and applicable privacy requirements.
Benefits of AI Event Intelligence & Audience Analytics
Brand Messenger can help organizations:
Understand actual event attendance
Analyze visitor traffic
Understand arrival and departure patterns
Analyze visitor movement
Identify high-traffic areas
Measure dwell patterns
Analyze zone performance
Evaluate booth engagement
Understand session attendance
Measure activation engagement
Analyze repeat visits
Understand crowd distribution
Identify congestion patterns
Analyze queues
Improve venue utilization
Compare event days
Compare multiple events
Build sponsor intelligence
Provide exhibitor analytics
Connect physical and digital event data
Integrate Face Signatures where appropriate
Connect registration and attendance
Integrate CRM and CDP
Connect event engagement with leads
Support post-event marketing automation
Develop audience segments
Add predictive event analytics
Build real-time or near-real-time dashboards where supported
Connect event activity with business outcomes
Develop executive event reporting
Build a continuous event-learning system
Why Choose Brand Messenger?
Brand Messenger combines AI Event Intelligence, Face Signatures integration, Visitor Analytics, Audience Intelligence, Attendance Analytics, Visitor Flow, Dwell Time, Engagement Analytics, Crowd Intelligence, Behavioral Insights, Smart Event Technology, CRM, CDP, Marketing Automation, Predictive Analytics and Executive Reporting within one connected event intelligence ecosystem.
We do not approach event analytics as:
Count Registrations → Count Attendees → Produce a Report.
We approach it as:
Understand the Audience → Measure Attendance → Analyze Movement → Understand Dwell → Measure Engagement → Study Crowd Patterns → Connect Physical and Digital Signals → Apply AI → Connect Leads and Customers → Measure Business Outcomes → Improve the Next Event.
The distinction matters.
AI Event Intelligence turns event signals into actionable analytical insights.
Face Signatures can provide an advanced physical-space AI and analytics layer where appropriate.
Visitor Analytics explains how audiences use the event environment.
Audience Intelligence helps understand different visitor groups and engagement patterns.
Attendance Analytics moves measurement beyond registrations toward actual event participation.
Visitor Flow Analytics reveals how people move between event spaces.
Dwell Time Analytics identifies where audiences spend their time.
Engagement Analytics measures interaction with booths, sessions, displays and activations.
Crowd Intelligence helps organizations understand density, flow, queues and congestion.
Behavioral Insights transform observed activity into hypotheses and opportunities for event improvement.
CRM, CDP and Marketing Automation connect the physical event with the continuing customer journey.
Predictive Analytics adds forward-looking intelligence where sufficient reliable data exists.
And Marketing Dashboard & KPI Reporting turns complex event information into operational and executive intelligence.
The result is not simply a smarter attendance counter.
It is an AI-powered intelligence layer for understanding how audiences experience physical events and how those experiences connect with marketing and business performance.
See the Audience. Understand the Movement. Measure the Engagement. Analyze the Experience. Turn Events into Intelligence.
AI Event Intelligence. Face Signatures Integration. Visitor Analytics. Audience Intelligence. Attendance. Flow. Dwell. Engagement. Crowd Intelligence. Behavioral Insights. One Connected Event Intelligence Ecosystem.