



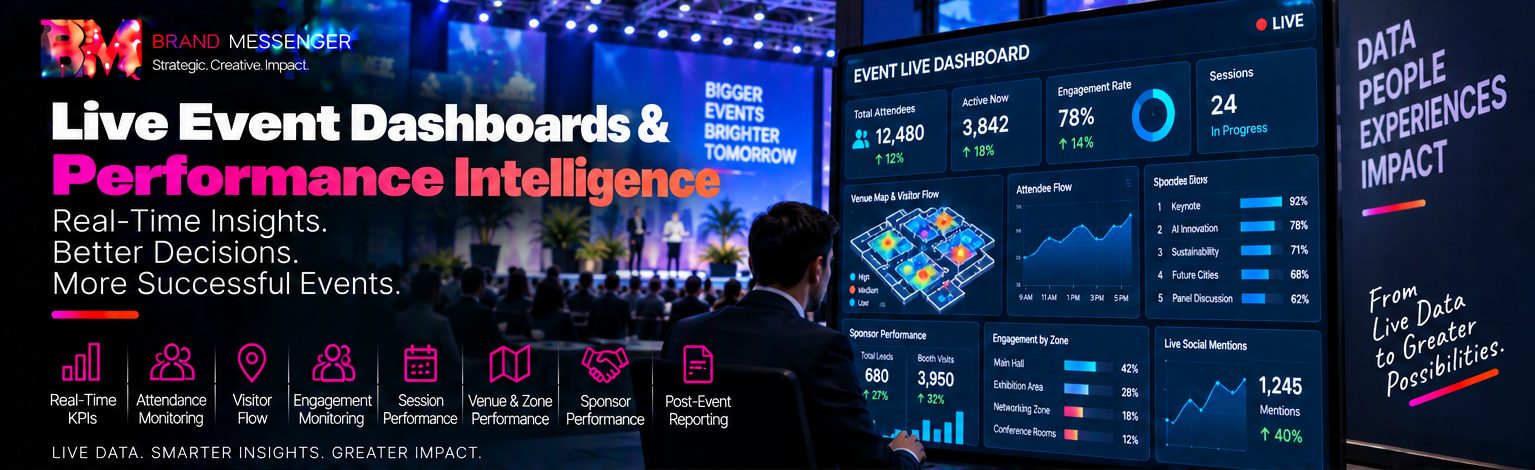
Live Event Dashboards & Performance Intelligence
See the Event as It Happens. Monitor What Matters. Understand Performance. Turn Live Event Data into Actionable Intelligence.
Modern events generate information continuously.
People register, arrive, check in, move through venues, enter sessions, interact with exhibitors, participate in polls, engage with content, attend networking activities and respond to different experiences. At the same time, organizers need to understand whether sessions are attracting audiences, which areas are active, where congestion may be developing, how sponsors and exhibitors are performing, and whether the event is progressing against its operational and business objectives.
The challenge is not simply collecting more event data.
It is turning relevant event signals into clear, timely and useful intelligence.
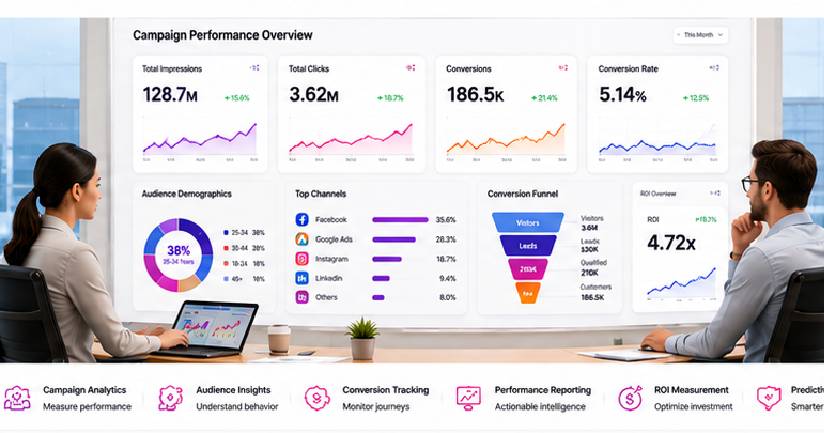
At Brand Messenger, our Live Event Dashboards & Performance Intelligence service connects event data, operational monitoring, audience analytics and business reporting within one event-intelligence environment—helping event teams understand what is happening before, during and after the event.
Our core capabilities include:
Live Event Dashboards
Real-Time KPI Monitoring
Attendance Monitoring
Visitor Flow Intelligence
Engagement Monitoring
Session Performance
Venue & Zone Performance
Sponsor Performance
Post-Event Reporting
Our wider capabilities can extend across registration dashboards, check-in monitoring, attendance trends, capacity intelligence, arrival patterns, visitor movement, dwell analysis, session analytics, audience participation, polling and Q&A analytics, networking performance, exhibitor analytics, sponsor activation analytics, event-app engagement, content performance, hybrid audience analytics, operational alerts, historical benchmarking, predictive event analytics, executive dashboards, CRM integration, marketing attribution and AI Event Intelligence.
Our event intelligence architecture connects:
Registration → Attendance → Movement → Sessions → Engagement → Networking → Sponsors & Exhibitors → Business Outcomes → Reporting → Learning
The objective is not:
Put Every Available Number on a Dashboard.
It is:
Give Event Teams the Right Intelligence at the Right Time to Understand Performance, Support Decisions and Continuously Improve the Event.
From Event Data to Event Intelligence
An event can generate information across many disconnected systems:
Registration Platform
Check-In System
Event App
Session Technology
Live Polling
Networking Platform
Exhibitor Systems
CRM
Physical-Space Analytics
Looking at each separately can create fragmented reporting.
Brand Messenger can structure a connected model:
Event Systems
↓
Relevant Event Data
↓
Data Integration
↓
Defined KPIs
↓
Live Event Dashboard
↓
AI & Performance Analysis
↓
Operational / Business Insights
↓
Decision Support
↓
Post-Event Intelligence
The result is not simply a reporting interface.
It becomes an event performance intelligence environment.
Live Intelligence Before, During & After the Event
Different phases require different information.
Before the Event
Registration
Ticket Sales
Audience Acquisition
Delegate Categories
Expected Attendance
Session Interest
During the Event
Check-In
Attendance
Visitor Flow
Sessions
Engagement
Networking
Venue Activity
Sponsor & Exhibitor Activity
After the Event
Final Attendance
Engagement Analysis
Session Performance
Sponsor Performance
Audience Insights
Lead & Business Outcomes
Event Performance Reporting
The intelligence lifecycle becomes:
Prepare → Monitor → Understand → Respond → Measure → Learn → Improve
Brand Messenger Live Event Dashboard & Performance Intelligence Services
Our capabilities can include:
Event KPI Strategy
Event Measurement Framework
Live Event Dashboards
Event Operations Dashboards
Executive Event Dashboards
Real-Time KPI Monitoring
Registration Dashboards
Ticketing Dashboards
Check-In Dashboards
Attendance Monitoring
Arrival Monitoring
Capacity Monitoring
Visitor Flow Analytics
Dwell Time Analytics
Zone Performance
Venue Performance
Session Performance
Speaker Session Analytics
Audience Engagement Monitoring
Live Poll Analytics
Q&A Analytics
Interactive Experience Analytics
Event App Analytics
Networking Analytics
Business Matchmaking Analytics
Meeting Analytics
Exhibitor Performance
Sponsor Performance
Sponsor Activation Analytics
Lead Analytics
Content Performance
Livestream Analytics
Hybrid Event Analytics
Virtual Audience Analytics
Physical Audience Analytics
Audience Segmentation
CRM Integration
Marketing Performance Integration
Revenue & Business Outcome Reporting
Historical Event Comparison
Multi-Event Intelligence
Predictive Event Analytics
AI-Assisted Event Intelligence
Operational Alerts
Post-Event Reporting
Executive Reporting
Event KPI Strategy
Measure What Matters to the Event
Before building a dashboard, Brand Messenger can define what the organization actually needs to understand.
Different events have different objectives.
A conference may prioritize:
Delegates → Sessions → Networking → Sponsors → Leads
An exhibition may prioritize:
Visitors → Traffic → Booth Engagement → Exhibitors → Leads
A product launch may prioritize:
Attendance → Engagement → Product Interest → Media → Follow-Up
A corporate event may prioritize:
Attendance → Participation → Content Engagement → Feedback
The principle is:
Start with the Business Question not the Available Data.
Event KPI Framework
A structured event KPI framework can include:
Audience KPIs
Registrations
Attendance
Participation
Experience KPIs
Sessions
Engagement
Content
Interaction
Venue KPIs
Traffic
Zones
Capacity
Dwell
Relationship KPIs
Networking
Meetings
Lead Activity
Commercial KPIs
Sponsors
Exhibitors
Leads
Revenue where measurable
Operational KPIs
Check-In
Arrival
Capacity
Event Activity
This creates a balanced event-performance view.
Live Event Dashboards
Create One Operational View of the Event
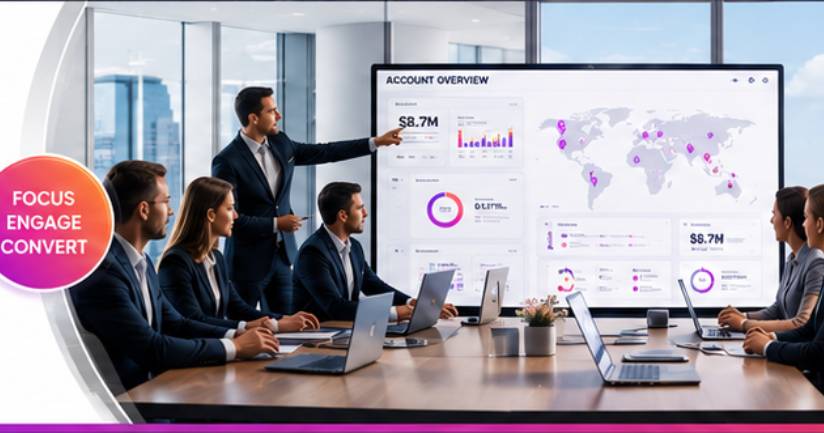
A live event dashboard can bring selected information together into one visual environment.
Potential dashboard areas can include:
Attendance
Venue
Sessions
Engagement
Networking
Sponsors
Exhibitors
Content
Operations
The objective is to reduce the need for teams to switch constantly between disconnected systems.
Real-Time KPIs
Depending on the available systems and data latency, dashboards can display current or near-real-time indicators such as:
Registrations
Check-Ins
Attendance
Arrival Rate
Session Activity
Venue Activity
Poll Participation
Networking Activity
Exhibitor Interaction
Sponsor Activation Activity
Not every source is genuinely real-time.
Brand Messenger can distinguish between:
Live Data
Near-Real-Time Data
and:
Periodically Updated Data
so that decision-makers understand the freshness of the information they are viewing.
Dashboard / Intelligence
A dashboard displays information.
Intelligence helps explain what deserves attention.
Brand Messenger can therefore connect:
Dashboard
Analytics
AI-Assisted Analysis
Human Event Expertise
to create:
Event Performance Intelligence
Attendance Monitoring
Understand Who Actually Arrived
Registration does not equal attendance.
A fundamental event funnel is:
Invited
↓
Registered
↓
Confirmed
↓
Checked In
↓
Attended
↓
Engaged
Brand Messenger can connect registration and smart check-in information to provide a clearer view of actual participation.
Registered vs. Attended
An event may receive:
10,000 Registrations
but the operational question is:
How Many Actually Attended?
Brand Messenger's Event Registration, Ticketing & Smart Check-In capabilities can connect registration with check-in data to distinguish intention from actual attendance.
Arrival Monitoring
Arrival analytics can help identify:
Early Arrivals
Peak Arrival Periods
Late Arrivals
Check-In Volume
Entry Patterns
This can support operational decisions around:
Registration Desks
Staffing
Entry Points
Guest Services
Attendance by Category
Attendance can be segmented appropriately by:
General Attendees
Delegates
VIPs
Speakers
Sponsors
Exhibitors
Media
Staff
This can help organizers understand participation across attendee groups.
Multi-Day Attendance
For multi-day events, dashboards can compare:
Day 01
Day 02
Day 03
to understand daily attendance patterns.
This can help distinguish:
Total Registered Audience
from:
Daily Active Attendance.
Attendance Monitoring + Capacity
Where reliable capacity information and attendance data are available, dashboards can support awareness of:
Venue Capacity
Session Capacity
Zone Occupancy
Registration Volume
This can support operational planning.
Technology should support—not replace—venue safety procedures and qualified event operations personnel.
Visitor Flow Intelligence
Understand How People Move Through the Event
A venue is not used uniformly.
Some routes may be highly active.
Some areas may attract strong visitor traffic.
Some spaces may be underused.
Some transition points may become congested.
Brand Messenger can connect appropriate physical-space analytics with event intelligence to understand:
Entry → Movement → Zone → Dwell → Transition → Exit
This can help organizers understand how the venue is actually being experienced.
Visitor Flow Dashboard
A visitor-flow dashboard can potentially visualize:
Traffic Volume
Movement Direction
Zone Activity
Peak Periods
Congestion Indicators
Dwell Patterns
depending on the available sensing and analytics technology.
The objective is:
See How the Event Is Actually Used not Simply How It Was Designed to Be Used.
Event Heatmaps
Aggregated event heatmaps can help visualize:
High-Activity Areas
Lower-Activity Areas
Traffic Routes
Dwell Zones
Exhibition Activity
These patterns can help support:
Layout Evaluation
Wayfinding
Exhibition Planning
Sponsor Placement
Operational Planning
A heatmap shows activity patterns.
It does not automatically explain why people behaved that way.
Dwell Time Intelligence
Understand Where Attendees Spend Time
Where appropriate analytics are available, dwell patterns can help evaluate:
Exhibition Areas
Sponsor Activations
Interactive Experiences
Networking Areas
Product Displays
Content Zones
Higher dwell is not automatically better.
Context matters.
For example, long dwell in a networking lounge may represent engagement.
Long dwell in an entrance queue may represent friction.
The principle is:
Measure the Pattern. Interpret the Context. Then Decide What It Means.
Venue Performance
Understand How the Physical Event Environment Performs
Venue-performance intelligence can bring together:
Attendance
Traffic
Zone Activity
Capacity
Dwell
Sessions
Exhibitions
Engagement
This can help event teams evaluate how effectively the physical environment supports the event program.
Venue Performance Dashboard
A venue dashboard can include appropriate views across:
Entrances
Arrival & Check-In
Conference Areas
Session Attendance
Exhibition
Visitor Activity
Networking Areas
Traffic & Dwell
Sponsor Zones
Activation Activity
Other Event Areas
Relevant utilization indicators
This creates a venue-level operational picture.
Zone Performance
Large events can be divided into defined zones.
For example:
Zone A — Main Conference
Zone B — Exhibition
Zone C — Networking
Zone D — Sponsor Experience
Zone E — Hospitality
Performance can then be analyzed by zone.
The architecture becomes:
Venue → Zone → Activity → Engagement → Performance
Zone Comparison
Where comparable data exists, organizers can evaluate:
Zone A vs. Zone B vs. Zone C
across appropriate measures such as:
Traffic
Dwell
Participation
Capacity Utilization
Comparisons should consider the purpose of each zone rather than assuming every space should generate identical behavior.
Session Performance
Understand Which Sessions Attract and Engage Audiences
Brand Messenger can connect session information with:
Registration
Session Selection
Attendance
Polling
Q&A
Feedback
Content Viewing
to create a more complete view of session performance.
Session Performance Dashboard
Potential indicators can include:
Session Registrations
Session Attendance
Capacity
Audience Participation
Poll Responses
Q&A Activity
Feedback
On-Demand Viewing where available
The objective is not to reduce session quality to one number.
It is to understand different dimensions of audience response.
Session Popularity
Organizers can compare:
Interest Before Event
with:
Attendance During Event
and:
Engagement During Session
This creates a useful sequence:
Interest → Attendance → Participation → Feedback
Session Capacity Intelligence
Where session registrations or attendance approach available capacity, event teams can use that information to support:
Room Allocation
Overflow Planning
Future Scheduling
This can also help improve planning for recurring events.
Speaker Performance Intelligence
Speaker/session reporting can include appropriate indicators such as:
Session Attendance
Audience Questions
Poll Participation
Feedback
These signals describe audience activity around the session.
They should not be treated as an absolute measure of a speaker's professional quality or expertise.
Engagement Monitoring
Measure Participation—not Just Presence
Attendance answers:
Were People There?
Engagement asks:
What Did They Do?
Potential engagement signals can include:
Poll Participation
Q&A
Surveys
Quizzes
Competitions
Gamification
Interactive Displays
Event App Activity
Content Interaction
Networking
Meetings
This connects directly with Brand Messenger's Event Audience Engagement & Interactive Experiences capabilities.
Live Engagement Dashboard
A live engagement view can potentially show:
Poll Participation
Questions Submitted
Interactive Activities
Networking Activity
App Engagement
depending on the technology deployed.
This helps organizers see which experiences are attracting active participation.
Live Poll Intelligence
Live polling can provide more than an audience-response moment.
Aggregated results can help organizers understand:
Participation Level
Response Distribution
Topic Interest
Session Interaction
Poll responses reflect answers to the questions asked.
They should not automatically be generalized into broader conclusions about attendees.
Q&A Analytics
Digital Q&A systems can provide signals such as:
Number of Questions
Topics
Session Participation
Audience Voting on Questions
This can help identify areas of strong audience curiosity.
Interactive Experience Performance
Brand Messenger can measure appropriate activity across:
Interactive Kiosks
Touch Displays
AR Experiences
VR Experiences
Games
Competitions
QR Experiences
The architecture becomes:
Experience → Interaction → Engagement Signal → Analysis
Event App Performance
For events using an app, appropriate analytics can include:
App Activation
Agenda Usage
Session Discovery
Content Interaction
Notifications
Networking
Polling
Other In-App Activities
depending on platform capabilities.
Networking Performance
Understand Whether the Event Is Helping People Connect
Networking is often one of the most valuable components of business events.
Potential analytics can include:
Networking Participation
Meeting Requests
Meetings Scheduled
Connections
Matchmaking Activity
Networking Session Participation
The architecture becomes:
Attendee → Discovery → Connection → Meeting → Relationship
A scheduled meeting is not automatically a successful business relationship.
The dashboard should report the activity that can actually be measured.
Business Matchmaking Analytics
For conferences, trade shows and business forums, Brand Messenger can analyze appropriate activity around:
Recommended Matches → Meeting Requests → Accepted Meetings → Meetings Scheduled
where the networking platform provides this information.
This can help organizers improve future matchmaking design.
Sponsor Performance
Move Beyond Logo Visibility
Sponsors increasingly need to understand how audiences interacted with their event presence.
Brand Messenger can connect appropriate sponsor activity across:
Sponsor Sessions
Activations
Exhibition Areas
Digital Content
Event App
Polls
Networking
Lead Capture
Livestream / Hybrid Environments
The objective is to provide a clearer view of sponsor participation and exposure where measurable.
Sponsor Performance Dashboard
Potential sponsor reporting can include:
Exposure
Applicable Digital / Event Visibility
Activation
Interaction with Sponsor Experiences
Content
Sponsor Content Engagement
Sessions
Sponsored Session Activity
Leads
Voluntarily Captured Leads where applicable
Meetings
Relevant Networking Activity
Digital
Virtual / App Interaction
The specific metrics should reflect the sponsor package and technology actually deployed.
Sponsor Performance Is More Than Impressions
A sponsor may care about:
Visibility
but also:
Engagement
Conversations
Leads
Meetings
Business Opportunities
The reporting architecture can therefore become:
Exposure → Engagement → Interaction → Lead / Relationship → Business Outcome
where those later-stage outcomes can be reliably measured.
Sponsor ROI
Where reliable investment and outcome data are available, Brand Messenger can help connect sponsor activity with defined business outcomes.
However:
Visibility ≠ Revenue
and:
Interaction ≠ Sale.
Sponsor ROI should therefore be calculated only where the required cost and outcome data support it.
Exhibitor Performance
Help Exhibitors Understand More Than Booth Traffic
Potential exhibitor intelligence can include:
Visitor Activity
Booth Interaction
Lead Capture
Product Interest
Meetings
Content Engagement
depending on the event technology.
This can help exhibitors evaluate their participation and improve future activation strategy.
Booth Traffic & Engagement
Where appropriate analytics are available:
Visitor Traffic
Dwell
Interactions
Lead Capture
can provide a richer picture than booth visits alone.
Lead Performance
Event leads can potentially be tracked through:
Captured Lead → CRM → Qualification → Opportunity → Customer
where the organization's CRM and sales process support this connection.
This allows event reporting to extend beyond the venue.
Event Content Performance
Brand Messenger's Event Content, Media & Live Production service can connect content activity with event intelligence.
Potential content analytics can include:
Livestream Viewing
Session Viewing
Video Engagement
On-Demand Viewing
Social Content Activity
Content Downloads
depending on platforms and tracking.
Livestream Performance
For hybrid events, livestream reporting can include appropriate:
Viewers
Viewing Duration
Session Viewing
Interaction
Geographic Distribution where available and appropriate
These should be analyzed separately from physical attendance.
Physical + Virtual Event Intelligence
For Hybrid Events, Brand Messenger can combine:
Physical
Registration
Check-In
Attendance
Venue
Sessions
Physical Engagement
Virtual
Registration
Stream Attendance
Viewing
Digital Engagement
Virtual Networking
into:
Unified Hybrid Event Intelligence
without pretending that physical and digital participation are identical metrics.
Hybrid Event Dashboard
A hybrid dashboard can show:
Physical Registrations | Virtual Registrations
Physical Attendance | Virtual Attendance
Physical Sessions | Digital Sessions
Venue Engagement | Online Engagement
Physical Networking | Virtual Networking
This gives organizers a connected but appropriately differentiated view.
Event Marketing Performance
Brand Messenger's Event Marketing & Audience Acquisition capabilities can connect:
Marketing Campaign → Registration → Attendance → Engagement
where appropriate tracking is available.
This allows organizers to evaluate which channels are associated with actual event participation rather than looking only at advertising clicks.
Registration Source Intelligence
Potential sources can include:
Search
Social
Paid Advertising
Partners
Speakers
Sponsors
Referral Campaigns
The architecture becomes:
Acquisition Source → Registration → Attendance → Engagement
where reliable source tracking exists.
Event Acquisition Cost
Where marketing-spend and registration data are available, organizations can evaluate measures such as:
Cost per Registration
and, with attendance data:
Cost per Attendee
These metrics can provide more useful context than media metrics alone.
Event Revenue Intelligence
Commercial events may generate revenue through:
Tickets
Sponsorship
Exhibition
Partnerships
Other Event Revenue
A business dashboard can connect these appropriate revenue sources with event investment.
Event ROI
Event ROI requires clearly defined inputs.
A simplified financial view may consider:
Measured Event Return − Event Investment
relative to:
Event Investment
But not every event objective is directly financial.
Events can also contribute to:
Relationships
Education
Brand Awareness
Community
Employee Engagement
Industry Positioning
Customer Experience
These should not be converted into invented financial values merely to produce an ROI percentage.
Event Performance / One Number
A successful event may perform strongly in one dimension and less strongly in another.
For example:
High Attendance
does not necessarily mean:
High Engagement.
And:
High Engagement
does not automatically mean:
High Revenue.
Brand Messenger therefore evaluates event performance across multiple dimensions.
AI Event Intelligence
Turn Event Signals into More Useful Analysis
Brand Messenger can connect event dashboards with AI Event Intelligence & Audience Analytics.
The architecture becomes:
Event Data
↓
AI-Assisted Analysis
↓
Patterns
↓
Anomalies
↓
Insights
↓
Human Interpretation
↓
Decision
The principle is:
AI Intelligence + Human Event Expertise.
AI-Assisted Event Insights
AI can potentially help identify patterns such as:
Unexpected Attendance Changes
Unusual Zone Activity
Session Demand
Engagement Changes
Registration Trends
where reliable data supports the analysis.
These should be treated as signals for investigation rather than automatic explanations.
Event Anomaly Detection
An anomaly might include:
Unexpected Drop in Check-In
Sudden Zone Congestion
Unusual Session Demand
Unexpected Change in Digital Engagement
An anomaly is:
A Signal for Investigation not Automatically an Explanation of Cause.
Predictive Event Analytics
Where sufficient historical and current data exists, predictive analytics can support estimates around:
Attendance
Arrival Patterns
Session Demand
Registration Pace
Venue Activity
Other Defined Event Demand
The architecture becomes:
Historical Data + Current Event Signals → Predictive Model → Planning Estimate
Predictions remain estimates rather than guarantees.
Predictive Attendance
Registration trends can potentially support estimates of expected attendance.
This may help with:
Staffing
Catering
Registration Desks
Venue Planning
Session Capacity
where the available data is sufficiently reliable.
Predictive Session Demand
Historical and pre-event interest data can potentially help estimate which sessions may attract greater demand.
This can support:
Room Allocation
Scheduling
Overflow Planning
but should not replace operational judgment.
Event Intelligence Alerts
Surface What Needs Attention
Instead of requiring teams to watch every dashboard continuously, systems can potentially surface alerts around defined thresholds or anomalies.
Examples might include:
Capacity Threshold Approaching
Check-In Volume Change
Session Demand Change
Venue Congestion Indicator
Technology / Data Issue
depending on available systems.
Alerts should support event teams not create unnecessary alarm.
Operational Event Dashboard
The operations team may need:
Attendance
Arrivals
Check-In
Capacity
Venue Activity
Session Status
Operational Alerts
This dashboard is designed for:
Running the Event.
Marketing Event Dashboard
The marketing team may need:
Campaign Performance
Registrations
Acquisition Sources
Attendance
Engagement
Content
Leads
This dashboard is designed for:
Understanding Audience Acquisition and Engagement.
Sponsor & Partnership Dashboard
The commercial team may need:
Sponsor Activations
Sponsored Sessions
Exhibitor Activity
Leads
Meetings
Digital Engagement
This dashboard is designed for:
Understanding Commercial Partner Performance.
Executive Event Dashboard
Give Leadership the Information That Matters
Executives generally do not need every operational metric.
A management-level view can focus on:
Audience
Registrations → Attendance
Experience
Sessions → Engagement
Relationships
Networking → Leads
Commercial
Sponsors → Revenue where measurable
Performance
Objectives → KPIs → Outcomes
The principle is:
Operational Detail for Event Teams. Decision Intelligence for Leadership.
Role-Based Dashboards
Different teams can receive different views.
Event Director
Overall Event Performance
Operations
Attendance + Venue + Capacity
Marketing
Acquisition + Registration + Engagement
Content Team
Sessions + Content
Commercial Team
Sponsors + Exhibitors + Leads
Executive Management
Business-Level KPIs
This helps prevent dashboards from becoming overloaded.
Event Command Center
For larger events, Brand Messenger can structure a command-center view connecting selected:
Registration
Check-In
Venue
Sessions
Engagement
Event Technology
Audience Intelligence
The objective is:
One Connected Operational View of the Live Event.
Face Signatures Integration
Where appropriate, Face Signatures by Messenger2050 Technologies may provide a supporting physical-space analytics layer within selected event environments.
Depending on deployment requirements, appropriate capabilities may contribute signals around:
Visitor Traffic
Movement
Zone Activity
Crowd Patterns
Repeat-Visit Trends
Physical-Space Engagement
These signals can complement digital information from:
Registration + Event Apps + Sessions + Polling + Networking + CRM
to create a broader event-intelligence environment.
Physical Intelligence Does Not Always Require Identity
Many event-performance questions can be answered using aggregated information.
For example:
How Busy Is This Zone?
Which Route Receives More Traffic?
Where Are Visitors Spending Time?
may not require identifying individual attendees.
Our principle remains:
Use Identity When Identity Is Necessary. Use Aggregated Intelligence When It Is Enough.
Where biometric or identity-linked processing is proposed, appropriate privacy, security, notice, permissions or other lawful basis, retention and governance requirements should be addressed.
Event Intelligence + Smart Event Technology
Brand Messenger's Event Technology & Smart Event Experiences can provide signals from:
Event Apps
Smart Badges
Kiosks
Touch Displays
Polling
Networking Technology
Interactive Experiences
These can connect with the performance-intelligence layer.
The architecture becomes:
Smart Event Technology → Event Signals → Performance Intelligence
Event Intelligence + Registration & Smart Check-In
Brand Messenger's Event Registration, Ticketing & Smart Check-In service provides important foundational information:
Registered → Confirmed → Checked In → Attended
This can form the beginning of the event-performance journey.
Event Intelligence + Audience Engagement
Brand Messenger's Event Audience Engagement & Interactive Experiences can provide engagement signals around:
Polls
Q&A
Competitions
Gamification
Interactive Content
Mobile Participation
These help answer:
Did the Audience Participate?
rather than simply:
Was the Audience Present?
Event Intelligence + CRM
Event leads and relationships can continue beyond the event.
The architecture becomes:
Event → Lead → CRM → Qualification → Opportunity → Customer
where the organization's systems and sales process provide the necessary information.
This can connect event activity with longer-term business performance.
Event Intelligence + CDP
Where appropriate, event data can connect with a Customer Data Platform.
The architecture can become:
Registration + Attendance + Engagement + CRM + Marketing → CDP → Customer / Audience Intelligence
subject to appropriate permissions and governance.
Event Intelligence + Marketing Automation
Event signals can support appropriate workflows such as:
Attended Session → Relevant Follow-Up
Requested Information → Sales / Marketing Follow-Up
Attended Event → Post-Event Content
This connects measurement with action.
Event Intelligence + Customer Journey Analytics
An event may be only one stage in a larger customer journey.
For example:
Advertisement → Registration → Event → Session → Product Interaction → Sales Conversation → Customer
Brand Messenger can connect appropriate event data with Customer Journey Analytics to understand this broader journey.
Data Integration
Connect Event Systems Without Losing Context
Brand Messenger can connect available event systems through appropriate:
APIs
Webhooks
Data Pipelines
Platform Integrations
Data Imports
The exact integration method depends on the technologies being used.
The objective is:
Connected Data with Clear Definitions not a Collection of Unrelated Metrics.
Event Data Quality
A dashboard can only be as reliable as the information feeding it.
Brand Messenger can consider:
Data Completeness
Duplicate Records
Tracking Consistency
Timestamp Alignment
KPI Definitions
Source Reliability
Data Freshness
before drawing conclusions.
KPI Definitions
Terms such as:
Attendee
Engagement
Lead
Session Attendance
can mean different things in different systems.
A useful dashboard should define what each KPI actually represents.
For example:
Registered Attendee / Checked-In Attendee
and:
Meeting Requested / Meeting Completed.
Clear definitions improve decision quality.
Data Freshness Indicators
Where practical, dashboards can indicate:
Live
Last Updated
Delayed
Finalized
status for relevant data.
This helps prevent teams from making decisions based on information they incorrectly assume is current.
Privacy-Aware Event Intelligence
Measure the Event Without Collecting More Personal Data Than Necessary
Event analytics can involve:
Registration Data
Attendance
App Activity
Networking
Physical-Space Signals
CRM Information
Brand Messenger's approach can incorporate:
Defined Purpose
Data Minimization
Appropriate Transparency
Permissions where required
Role-Based Access
Security
Retention Policies
Aggregation where sufficient
The principle is:
Understand Enough to Improve the Event Without Collecting More Personal Data Than the Purpose Requires.
Aggregated Intelligence First
For many event-performance questions, aggregated information may be sufficient.
For example:
Zone Traffic
rather than:
Named Individual Movement
or:
Session Attendance Level
rather than:
Individual Behavioral Profile
where individual-level information is unnecessary.
Responsible AI in Event Intelligence
AI-assisted event analysis should not automatically infer:
Intent
Personality
Satisfaction
Motivation
from limited behavioral signals.
A person spending more time in one area may have many possible reasons.
The responsible analytical model is:
Observed Data → Interpretation → Hypothesis → Validation
not:
Observed Data → Assumed Human Motivation.
Post-Event Reporting
Turn the Event into a Learning System
The dashboard should not disappear when the event closes.
Brand Messenger can convert event data into structured post-event reporting covering appropriate:
Registration
Attendance
Audience
Sessions
Engagement
Venue
Networking
Sponsors
Exhibitors
Content
Marketing
Leads
Business Outcomes
This creates a foundation for future event improvement.
Post-Event Executive Report
A management report can summarize:
Event Overview
Audience
Format
Objectives
Attendance
Registration
Actual Attendance
Engagement
Sessions
Interaction
Networking
Commercial
Sponsors
Exhibitors
Leads
Revenue where measurable
Intelligence
Key Patterns
Areas for Investigation
Improvement Opportunities
Recommendations
Future Event Actions
This turns event reporting into decision support.
Sponsor Post-Event Reports
Individual sponsor reports can provide appropriate information around:
Package Deliverables
Relevant Visibility
Activation Engagement
Sponsored Session Performance
Leads where applicable
Digital Engagement
This can help sponsors evaluate participation and support future partnership discussions.
Exhibitor Post-Event Reports
Exhibitor reporting can include:
Booth Activity
Engagement
Leads
Meetings
Product Interest
where these metrics are available.
Session Post-Event Reports
Program teams can review:
Attendance
Capacity
Engagement
Questions
Polls
Feedback
On-Demand Viewing
to improve future programming.
Historical Event Benchmarking
Compare Events Over Time
Recurring events can build a valuable historical dataset.
For example:
2026 Event
↓
2027 Event
↓
2028 Event
This can help identify changes in:
Registration
Attendance
Session Demand
Engagement
Networking
Sponsor Performance
provided that definitions and measurement methods remain sufficiently comparable.
Multi-Event Intelligence
Organizations running multiple events can create portfolio-level intelligence across:
Event A + Event B + Event C + Event D
This can support comparisons by:
Event Type
Market
City
Audience
Format
Business Objective
Event Performance Intelligence Maturity Model
Level 01 — Basic Event Reporting
Registration + Attendance + Manual Reporting
Level 02 — Live Operational Dashboard
Check-In + Attendance + Basic Live KPIs
Level 03 — Engagement Intelligence
Sessions + Polls + Q&A + Networking + Content
Level 04 — Connected Event Intelligence
Registration + Venue + Engagement + Sponsors + CRM + Marketing
Level 05 — Business Performance Intelligence
Event Activity → Leads → Opportunities → Revenue / Defined Business Outcomes
Level 06 — AI-Powered Event Intelligence
Connected Event Data + Live Dashboards + AI Analysis + Predictive Intelligence + Executive BI
The objective is not to create the most complicated dashboard.
It is:
Create the Level of Intelligence the Organization Can Actually Use.
Complete Brand Messenger Live Event Intelligence Process
A comprehensive engagement can follow:
Event Objectives
↓
Business Questions
↓
KPI Framework
↓
Event Systems
↓
Data Sources
↓
Integration Architecture
↓
Dashboard Design
↓
Registration Monitoring
↓
Attendance Monitoring
↓
Visitor Flow
↓
Venue & Zone Performance
↓
Session Performance
↓
Engagement Monitoring
↓
Networking Intelligence
↓
Sponsor & Exhibitor Performance
↓
Content Performance
↓
Operational Alerts
↓
AI-Assisted Analysis
↓
Executive Dashboard
↓
Post-Event Reporting
↓
Historical Benchmarking
↓
Future Event Optimization
The lifecycle becomes:
Measure → Monitor → Understand → Respond → Analyze → Report → Learn → Improve
Across the Brand Messenger Event Intelligence Ecosystem
Event Marketing & Audience Acquisition
Generate Audience Demand
↓
Event Registration, Ticketing & Smart Check-In
Create Registration, Credential and Attendance Signals
↓
Event Technology & Smart Event Experiences
Create Digital Event Touchpoints
↓
Hybrid Events
Connect Physical + Virtual Audience Data
↓
Event Audience Engagement & Interactive Experiences
Create Participation and Engagement Signals
↓
Event Content, Media & Live Production
Create and Distribute Event Content
↓
AI Event Intelligence & Audience Analytics
Analyze Audience, Attendance, Movement and Engagement
↓
Live Event Dashboards & Performance Intelligence
Live Dashboards • Real-Time KPIs • Attendance • Visitor Flow • Engagement • Sessions • Venue & Zones • Sponsors • Post-Event Reporting
↓
CRM + CDP
Connect Event Data with Customer Relationships
↓
Marketing Automation
Turn Relevant Event Signals into Follow-Up
↓
Customer Journey Analytics
Understand the Event Within the Wider Customer Journey
↓
Predictive Analytics
Add Forward-Looking Intelligence
↓
Marketing Dashboard & KPI Reporting
Connect Event Performance with Wider Marketing and Business Intelligence
The complete architecture becomes:
Audience → Registration → Attendance → Movement → Engagement → Sessions → Networking → Sponsors → Leads → Business Outcomes → Intelligence → Improvement
Events We Can Support
Brand Messenger Live Event Dashboards & Performance Intelligence can support appropriate applications across:
Conferences
Business Summits
Executive Forums
Conventions
Seminars
Symposiums
Trade Shows
Exhibitions
Corporate Events
Product Launches
Brand Activations
Award Shows
Ceremonies
Film Festivals
Entertainment Events
Festivals
Sports Events
Investor Events
Customer Events
Partner Events
Dealer & Distributor Events
Government & Institutional Events
Educational Events
Hybrid Events
Virtual Events
Multi-Day Events
Multi-Venue Events
Multi-City Events
International Events
Benefits of Live Event Dashboards & Performance Intelligence
Brand Messenger can help organizations:
Create a clear event KPI framework
Build live operational dashboards
Monitor real-time or near-real-time event KPIs
Track registration and actual attendance
Understand arrival patterns
Monitor visitor flow
Analyze dwell and zone activity
Evaluate venue utilization
Understand session performance
Monitor audience engagement
Analyze polls and Q&A
Measure networking activity
Evaluate sponsor activations
Develop exhibitor reporting
Connect physical and virtual event performance
Analyze event content
Connect event marketing with attendance
Integrate CRM and event data
Connect leads with business outcomes where measurable
Use AI-assisted event analysis
Identify operational anomalies
Apply predictive analytics where reliable data supports it
Build role-based dashboards
Create executive event intelligence
Develop post-event reports
Create sponsor and exhibitor reports
Compare recurring events
Build multi-event intelligence
Improve future event planning with evidence
Why Choose Brand Messenger?
Brand Messenger combines live dashboards, event technology, attendance monitoring, visitor-flow intelligence, engagement analytics, session performance, venue intelligence, sponsor analytics, AI Event Intelligence, CRM integration, predictive analytics and executive reporting within one connected event-performance ecosystem.
We do not approach event dashboards as:
Collect Data → Add Charts → Display Numbers.
We approach them as:
Define the Objective → Identify the Business Questions → Establish the KPIs → Connect the Relevant Systems → Monitor the Event → Understand Patterns → Surface What Needs Attention → Measure Outcomes → Report Clearly → Apply the Learning to the Next Event.
The distinction matters.
Live Event Dashboards provide visibility.
Real-Time KPI Monitoring keeps important indicators in view.
Attendance Monitoring distinguishes registrations from actual participation.
Visitor Flow Intelligence shows how the physical event environment is being used.
Engagement Monitoring measures participation beyond presence.
Session Performance helps organizers understand program activity.
Venue & Zone Performance provides intelligence about physical-space utilization.
Sponsor Performance connects sponsorship with measurable activation and engagement where data is available.
AI Event Intelligence helps identify patterns and signals requiring attention.
Executive Dashboards turn operational complexity into decision-level information.
And Post-Event Reporting turns a completed event into intelligence for the next one.
The result is not simply another analytics screen.
It is a connected event performance intelligence environment designed to help organizers see the event, understand the audience, monitor operations, evaluate performance and continuously improve future experiences.
See the Event. Monitor the Audience. Understand the Performance. Act on the Intelligence. Improve What Comes Next.
Live Event Dashboards. Real-Time KPIs. Attendance Monitoring. Visitor Flow. Engagement Monitoring. Session Performance. Venue & Zone Performance. Sponsor Performance. Post-Event Reporting. One Connected Event Performance Intelligence Ecosystem.